


Ichimoku Analysis (Daily chart)
Tenken-Sen- 7025
Kijun-Sen-6996
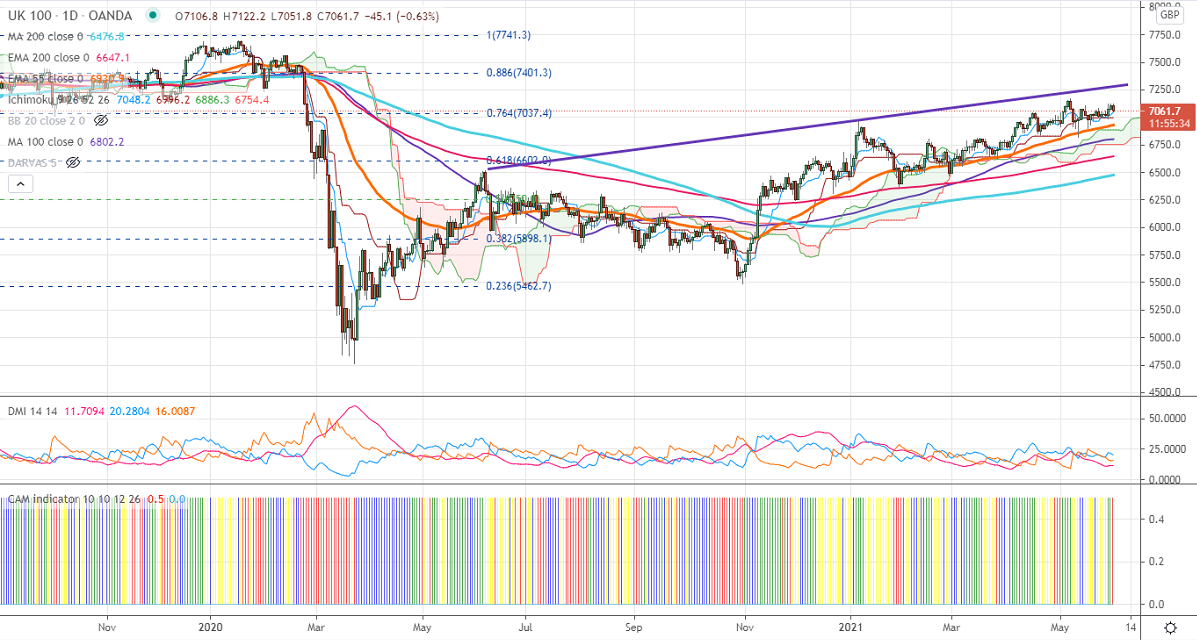
FTSE100 surged till 7124 as oil stocks jumped sharply. The WTI crude oil prices hit 2 –year high after OPEC plans to increase oil production through July in place as per April's decision. The start of the third wave in the UK is putting pressure on the index at higher levels. The lockdown end by June 21st is highly doubtful due to the spread of the Indian corona variant. FTSE100 should break above channel resistance 7280 for further bullishness. The FTSE100 hits an intraday high of 7122 and currently trading around 7062.9.
The near-term resistance to be watched is 7125 any break above will take the index till 7170/7220. Significant bullish trend continuation only if it closes above 7200. On the lower side, near-term support is around 7020, and any violation below targets 6985/6920/6900/6820.
Indicator (Daily chart)
CAM indicator – Bullish
Directional movement index – Neutral
It is good to sell on rallies 7170-75 with SL around 7240 for the TP of 6820.


