


Ichimoku Analysis (4- Hour chart)
Tenken-Sen- 6710
Kijun-Sen-6739
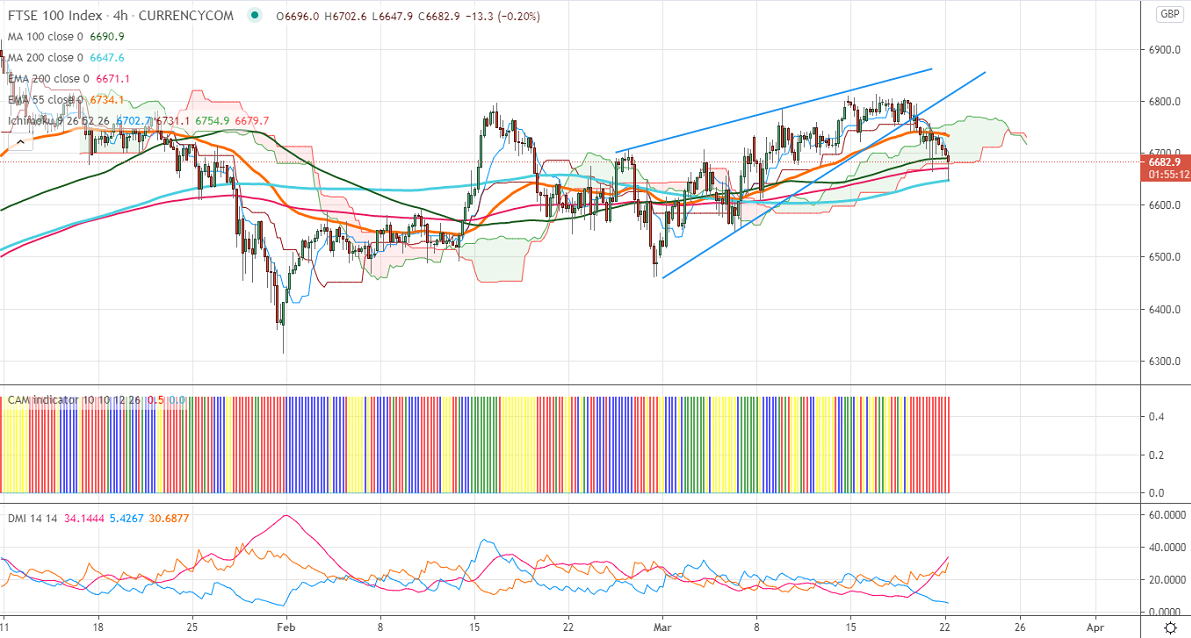
FTSE100 continues to trade lower for fifth consecutive days on global markets sell-off. The surge in US bond yield and increase in the number of new cases in Europe is dragging the markets down. The slow rollout of vaccines in European countries also putting pressure on FTSE100 at higher levels. US markets especially S&P500 lost 2.5% from an all-time high of 3987.4. FTSE100 hits an intraday low of 6647 and currently trading around 6689.
The near-term resistance to be watched is 6725; any violation above will take the index till 6750/6788/6805. Significant bullish trend continuation only if it crosses 7000. On the lower side, near-term support is around 6645, and any violation below targets 6600/6549.
Indicator (1 Hour chart)
CAM indicator – Bearish
Directional movement index – Bearish
It is good to sell on rallies around 6745-50 with SL around 6800 for the TP of 6600.


