


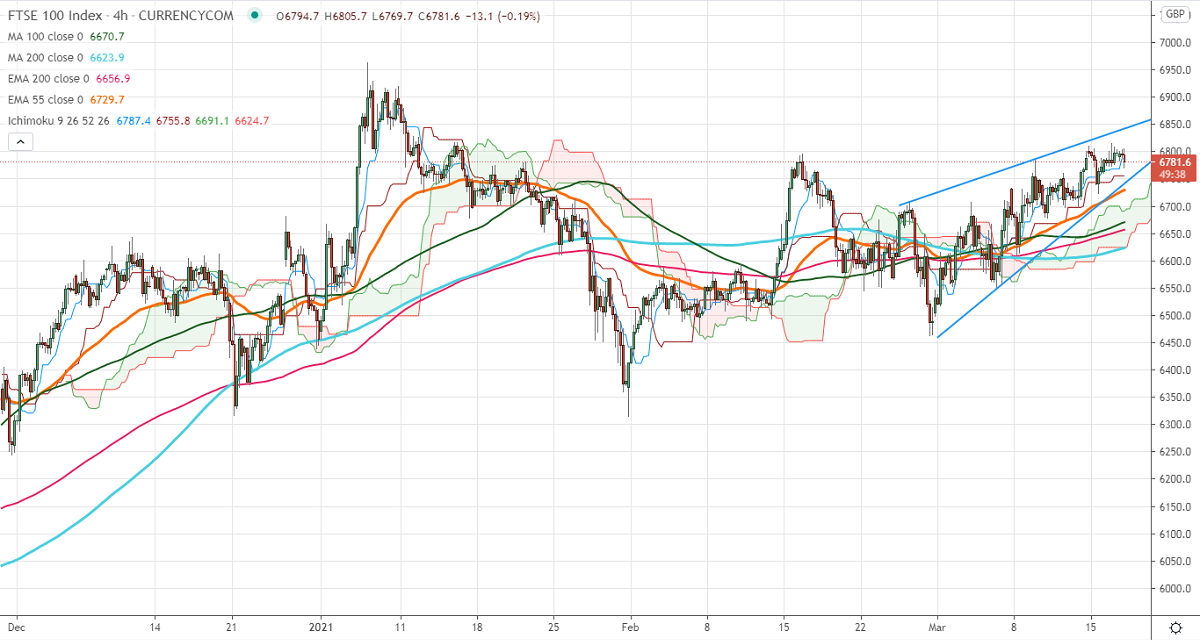
Chart pattern- Ascending broadening wedge
Ichimoku Analysis (4- Hour chart)
Tenken-Sen- 6786
Kijun-Sen-6755
FTSE100 declined slightly after a minor jump above the 6800 levels. The index has formed Ascending broadening wedge pattern and significant bullish continuation only above 6850. The UK index is trading flat ahead of US Fed and BOE monetary policy statement for further direction. The number of coronavirus death has become low and UK PM optimistic comments on the AstraZeneca vaccine are supporting FTSE100 at lower levels. It hits an intraday low of 6806 and currently trading around 6787.50.
The near-term resistance to be watched is 6820; any violation above will take the index till 6890/6963. Significant bullish trend continuation only if it crosses 7000. On the lower side, near-term support is around 6720, and any violation below targets 6670/6600.
Indicator (1 Hour chart)
CAM indicator – Bearish
Directional movement index – Bearish
It is good to sell on rallies around 6845-50 with SL around 6900 for the TP of 6600.


