


EUR/NZD chart - Trading View
- EUR/NZD is trading in an extremely narrow range with session highs at 1.6437 and lows at 1.6394.
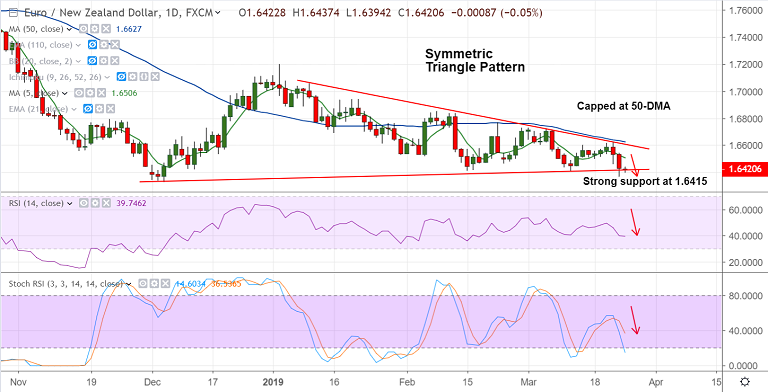
- The pair is pivotal at 'Triangle Base' support at 1.6415, break below will accentuate weakness.
- The single currency fell sharply after release of downbeat French and German PMIs.
- The pair is trading in a ' Symmetric Triangle' pattern and upside remains capped at 50-DMA.
- Technical indicators are biased lower. Momentum with the bears. Breach at 1.6415 can see weakness till 200W SMA at 1.6360.
- Focus on German IFO Business Climate index for further impetus. Break below 200W SMA likely to confirm further weakness.
Support levels - 1.6415 (Triangle base), 1.6360 (200W SMA), 1.6334 (Dec 4 2018 low)
Resistance levels - 1.6505 (5-DMA) 1.6545 (21-EMA), 1.6627 (50-DMA)
For details on FxWirePro's Currency Strength Index, visit http://www.fxwirepro.com/currencyindex.


