


 Global Markets React to Strong U.S. Jobs Data and Rising Yields
  Oil Prices Dip Slightly Amid Focus on Russian Sanctions and U.S. Inflation Data
  Indonesia Surprises Markets with Interest Rate Cut Amid Currency Pressure
  China’s Growth Faces Structural Challenges Amid Doubts Over Data
  US Futures Rise as Investors Eye Earnings, Inflation Data, and Wildfire Impacts
  U.S. Treasury Yields Expected to Decline Amid Cooling Economic Pressures
  Bank of America Posts Strong Q4 2024 Results, Shares Rise
  Mexico's Undervalued Equity Market Offers Long-Term Investment Potential
  Gold Prices Slide as Rate Cut Prospects Diminish; Copper Gains on China Stimulus Hopes
  Trump’s "Shock and Awe" Agenda: Executive Orders from Day One


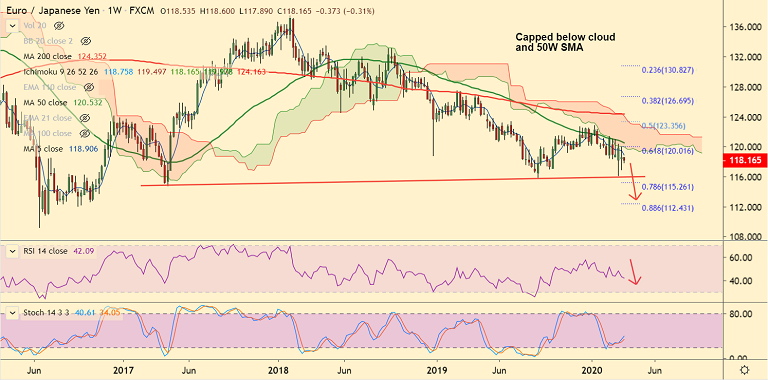
EUR/JPY chart - Trading View
EUR/JPY was trading 0.36% lower on the day at 118.16 at around 05:40 GMT, after closing 0.17% higher in the previous session.
Fears of a coronavirus-led slowdown in the global economy were bolstered after the US Senate's failure to push forward the rescue package.
The pair has failed to break past 21W EMA and weekly cloud and 5W SMA has turned sharply lower.
GMMA indicator shows major and minor trend on the weekly charts is strongly bearish.
Indicators on the daily charts have turned neutral, but the pair has completed a 'Death Cross' on the daily charts which could plummet prices.
Lower Bollinger band at 116.86 is immediate support ahead of major trendline support at 116. Break below eyes 78.6% Fib at 115.26.
On the flipside 21-EMA is immediate resistance at 118.84. Break above 50W SMA (120.53) could support near-term upside.
Support levels - 116.86 (Lower BB), 116 (Trendline)
Resistance levels - 118.84 (21-EMA), 120.53 (50W SMA)


