


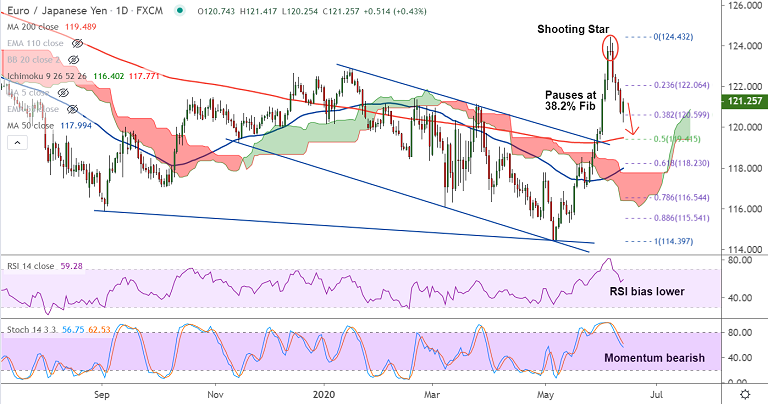
EUR/JPY chart - Trading View
Technical Analysis: Bias Bearish
GMMA Indicator
- Major trend is bullish
- Minor trend is bearish
Ichimoku Analysis
- Price action is above cloud, but Chikou Span is showing slight dip
- Bullish Tenkan Sen crossover on Kijun Sen supports upside
Oscillators
- Oscillators are in neutral territory
- Stochs and RSI have rolled over from overbought zone, bias neutral
Bollinger Bands
- Bollinger bands are widening on weekly charts and shrinking on the daily charts
- Volatility remains high, scope for big price moves
Major Support: 119.48 (200-DMA)
Major Resistance: 122.06 (23.6% Fib)
Summary: Major trend is bullish. The pullback on account of overbought oscillators has paused at 38.2% Fib. 200-DMA is major support at 119.48. Further weakness only on break below.


