EUR/JPY chart - Trading View
Technical Analysis: Bias Bullish
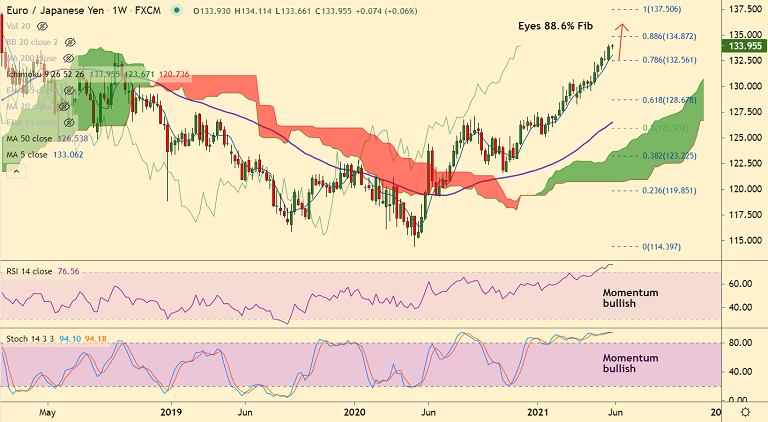
- EUR/JPY was trading 0.05% higher on the day at 133.97 at around 10:30 GMT
- GMMA indicator shows major and minor trend are strongly bullish
- Price action is above cloud and major moving averages
- MACD and ADX support upside, momentum strongly bullish
- Price action has shown a decisive break above 200-month MA opening upside
- Volatility is high and rising as evidenced by widening Bollinger bands
Support levels - 133.73 (5-DMA), 133, 132.76 (21-EMA)
Resistance levels - 134.31 (Upper BB), 134.87 (88.6% Fib), 135
Summary: EUR/JPY trades with a bullish bias. Close above 200-month MA has buoyed bulls in the pair. Scope for test of 137.50 (2018 high).


FxWirePro: EUR/NZD runs out of steam but maintains bullish outlook
FxWirePro: USD/JPY extends fall as yen rises on intervention fears
FxWirePro- Major US Indices
ETHUSD Dip: Prime Buy Zone to $3600 Targets
FxWirePro- Major European Indices
FxWirePro: GBP/USD advances on steady UK GDP growth
Pound Strike Forces EURGBP Retreat – Next Stop 0.8660?
AUDJPY: Buy-the-Dip Strategy Intact Above 103.80 Despite Profit-Taking Pullback
FxWirePro: GBP/AUD loses momentum but bullish setup remains
FxWirePro: NZD/USD maintains bullish bias with focus on 0.5900
Bitcoin Stuck in No-Man’s-Land: $85K Dip or $100K Breakout Next?
FxWirePro: USD/ZAR down trend loses steam, remains on bearish path
FxWirePro- Major Pair levels and bias summary
FxWirePro: GBP/NZD bulls loosen their grip a bit, dips to be bought
FxWirePro-Major European Indices 


