


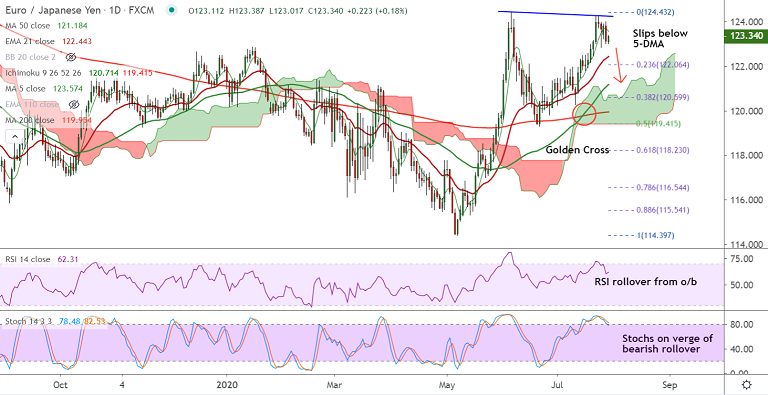
EUR/JPY chart - Trading View
Technical Analysis: Slightly bearish
GMMA Indicator
- Major trend is bullish
- Minor trend shows slight weakness
Ichimoku Analysis
- Price action is above cloud on the daily and weekly charts
- Chikou Span is showing slight weakness and turn lower on the weekly charts
Oscillators
- RSI is in neutral territory and biased lower, but holds above the 50 mark
- Stochastics are on verge of rollover from overbought levels
Bollinger Bands
- Bollinger bands are widening on the daily and weekly charts
- Rising volatility with bullish momentum could see further gains
Summary: Weakness in the pair is likely to be capped at 110W EMA. 'Golden Cross' on the daily charts cushions downside. Resumption of upside will see test of 200W MA at 124.76 ahead of 50% Fib at 125.95.


