


EUR/JPY chart - Trading View
Technical Analysis: Bias Bullish
GMMA Indicator:
- Major Trend: Neutral
- Minor Trend: Strongly Bullish
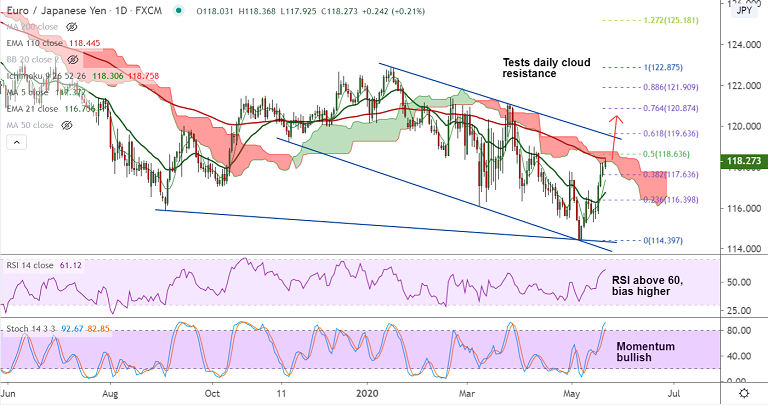
Ichimoku Analysis:
- The pair is finding stiff resistance at daily cloud
- Upside is capped at cloud base from the past 3 sessions
Oscillators:
- RSI is above 60 and shows strong upside momentum
- Stochs are biased higher, approaching overbought levels, but no signs of reversal seen
Bollinger Bands:
- Bollinger Bands are widening on the daily charts, volatility is high and rising
High/Low:
- Previous Week High/Low - 116.85/ 115.26
- Previous Session High/Low - 118.20/ 117.55
Major Support Levels: 117.63 (38.2% Fib), 117.48 (55-EMA), 116.75 (21-EMA)
Major Resistance Levels: 118.44 (110-EMA), 118.75 (Cloud top), 119.25 (200-DMA)
Summary: EUR/JPY is extending bullish streak for the 4th straight session. Momentum strongly bullish and volatility is high. Price action is has entered into daily cloud. Breakout at 110-EMA resistance will buoy prices. Scope for gains till 200-DMA at 119.25 ahead of 61.8% Fib at 119.63.


