


EUR/GBP chart - Trading View
Spot Analysis:
EUR/GBP was trading 0.08% higher on the day at 0.8586 at around 07:10 GMT
Previous Week's High/ Low: 0.8562/ 0.8500
Previous Session's High/ Low: 0.8613/ 0.8573
Fundamental Overview:
The Eurozone Manufacturing purchasing managers index (PMI) prints at a 7-month low of 58.7 in September vs. 60.3 expectations and 61.4 last.
The Bloc’s Services PMI drops to 56.3 in September vs. 58.5 expected, data released by IHS/Markit research showed on Thursday.
Further, German manufacturing sector sharply slows its pace of expansion in September. German Manufacturing PMI arrives at 58.5 vs. 61.5 expected, while Services PMI eases to 56.0 vs. 60.2 expected.
Composite Output Index arrived at 53.3 in September vs. 62.2 expected and August’s 60.0, its lowest levels in seven months.
The single currency depressed after weaker-than-expected PMIs across the eurozone.
The Bank of England's monetary policy committee meets later on Thursday. Traders expect the central bank to keep rates steady.
Technical Analysis:
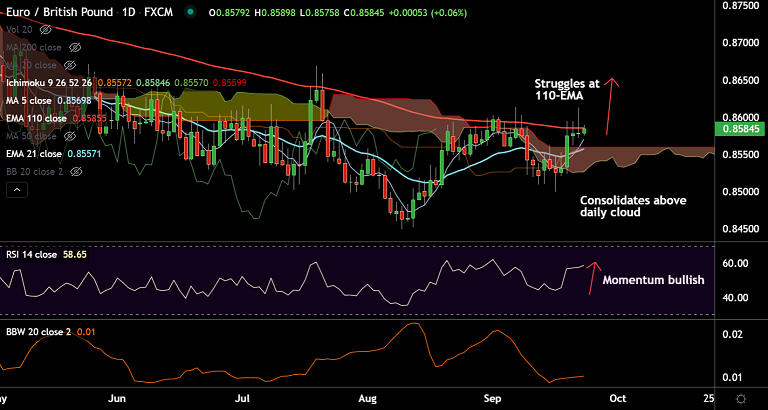
- EUR/GBP has formed back-to-back Doji formations on the daily charts
- Price action is capped at stiff resistance at 110-EMA at 0.8585
- The pair is consolidating above daily cloud and retrace below will see downside resumption
- Momentum is bullish. Stochs are biased higher and RSI holds above the 50 mark
Major Support and Resistance Levels:
Support - 0.8568 (5-DMA), Resistance - 0.8585 (110-EMA)
Summary: EUR/GBP technical bias is bullish. But the pair is capped at 110-EMA resistance. Watch out for decisive break above for further gains. On the flipside, retrace below cloud will see downside resumption.


