


EUR/CHF chart - Trading View
Technical Analysis: Bias Slightly Bullish
GMMA Indicator
- Major tend is bullish, minor trend is turning bullish on the daily charts
- On the weekly charts, major trend is neutral, while minor trend is bullish
Ichimoku Analysis
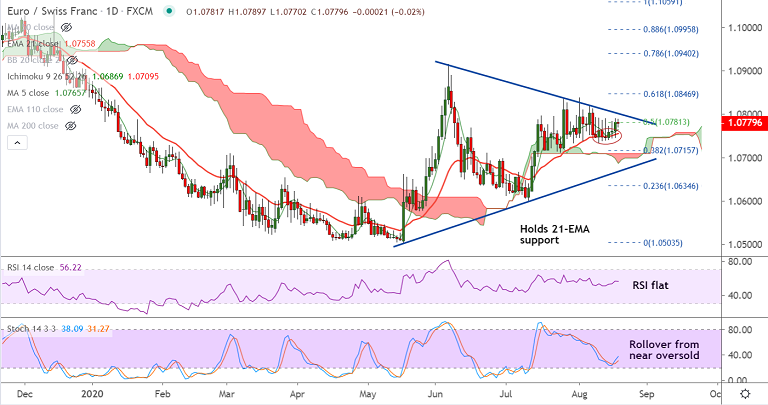
- EUR/CHF trades above daily cloud, but Chikou span is flat
- Weekly cloud offers stiff resistance, break into cloud will buoy prices
Oscillators
- RSI is flat, but holds above the 50 mark.
- Stochastics have turned North from near oversold levels
Bollinger Bands
- Bollibger bands are widening on the daily and weekly charts
- Widening Bollinger bands suggests rising volatility
Major Support Levels: 1.0764 (20-DMA), 1.0755 (21-EMA)
Major Resistance Levels: 1.0787 (55W EMA), 1.0808 (Upper BB)
Summary: The pair holds scope for upside. Decisive breakout at 55W EMA and weekly cloud base will buoy bulls in the pair. Next major bull target lies at 61.8% Fib at 1.0846. Weakness only below 21-EMA.


