


 Elon Musk’s Empire: SpaceX, Tesla, and xAI Merger Talks Spark Investor Debate
  BTC Flat at $89,300 Despite $1.02B ETF Exodus — Buy the Dip Toward $107K?
  FxWirePro- Major Crypto levels and bias summary


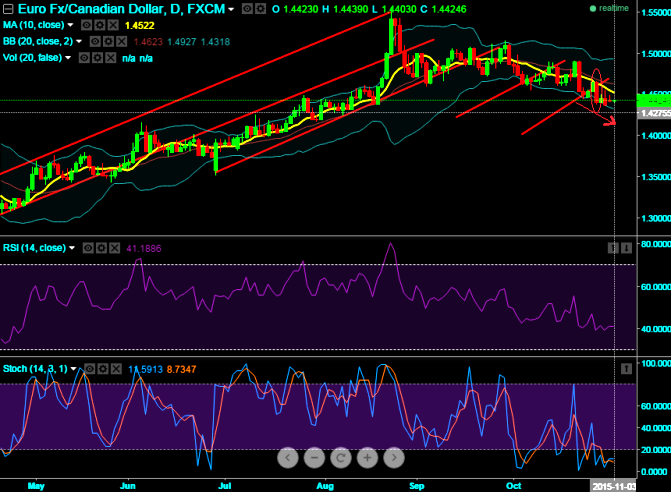
It seems to have a continued down streaks upon formation of back to back bearish patterns both on weekly and daily charts.
We again spot out "Bearish Engulfing" pattern candle formed at 1.4408 levels on daily charts of EURCAD to emphasize a caution for bulls and active signals for bears. Currently, the pair has been maintaining at around 1.4422 levels after breaking previous trendline on last Wednesday.
As you can observe a candle with long red real body (see circled area) with shadows on either side has engulfed the previous bull candle. This bearish pattern at 1.4408 has fallen way below 10DMA convincingly and these levels were maintained for 3 consecutive days.
On weekly charts also doji occurred at 1.4909 which was occurred exactly on a trendline breach, this has shown its significance by travelling the channel line distance about 225 pips.
In addition to that leading oscillators also substantiate these price slumps by showing linear convergence to these declines. RSI (14) on weekly looks healthily converging with every price declines at 50.3108.
It has been showing the same indication right from overbought territory. So, RSI signifies the prevailing down streaks may sustain for some slumps.
While another leading oscillator (slow stochastic) hints us the overbought heaviness through %D crossover above 80 levels which is again overbought zone. Hence, we could see the pair may find next strong support at around 1.4355 levels.

- News

- Economy

- Central Banks
- Investing
- Research
- Roundups
- Digital Currency
- Insights
- Technical Analysis
- Technology
- Business
- Law
- Health
- Nature
- Fintech
- Science
- Topic
- Opinions
- ©Econometrics LLC . All Rights Reserved.
FxWirePro: EUR/CAD bearish engulfing again to break channel line – likely to evidence more slumps
Tuesday, November 3, 2015 9:37 AM UTC
Editor's Picks


- Market Data
Most Popular


