


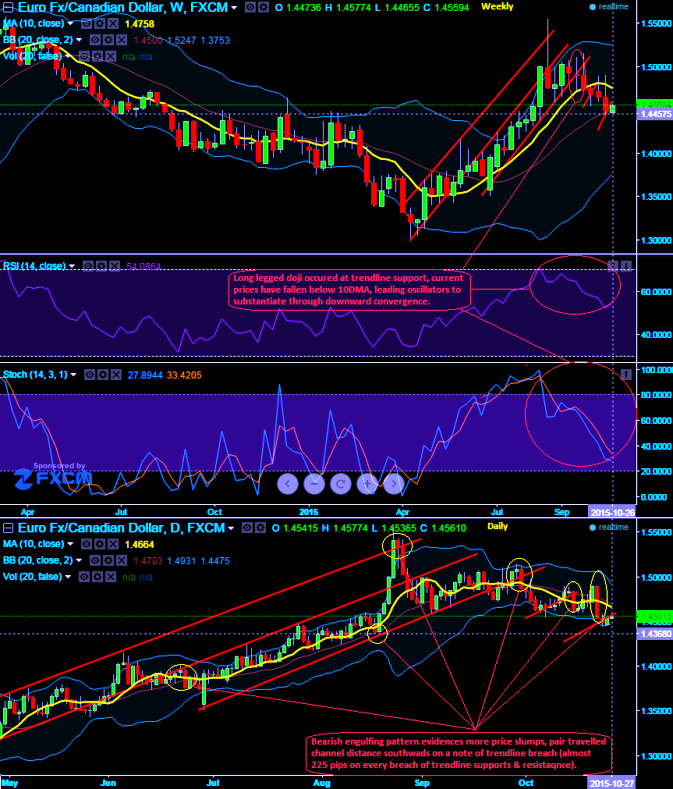
On daily charts of EURCAD, we spot out "Bearish Engulfing" pattern candle formed to emphasize a caution for bulls and active signals for bears. Currently, the pair is testing trendline resistance around 1.4560 levels.
As you can observe a candle with long red real body with shadows on either side has engulfed the previous bull candle. This bearish pattern at 1.4539 has fallen below 10DMA convincingly and it has been maintained for 3 consecutive days.
On weekly charts also doji occurred at 1.4909 which was occurred exactly on a trendline breach, this has shown its significance by travelling the channel line distance around 225 pips.
In addition to that leading oscillators also substantiate these price slumps by showing linear convergence to these declines. RSI (14) on weekly looks healthily converging with every price declines at 54.1227.
It has been showing the same indication right from overbought territory. So, RSI signifies the prevailing down streaks may sustain for some slumps.
While another leading oscillator (slow stochastic) hints us the overbought heaviness through %D crossover above 80 levels which is again overbought zone. Hence, we could see our next targets at 1.4355 levels on south.

- News

- Economy

- Central Banks
- Investing
- Research
- Roundups
- Digital Currency
- Insights
- Technical Analysis
- Technology
- Business
- Law
- Health
- Nature
- Fintech
- Science
- Topic
- Opinions
- ©Econometrics LLC . All Rights Reserved.
FxWirePro: EUR/CAD travels channel distance with bearish engulfing – lingering around trendline
Tuesday, October 27, 2015 7:12 AM UTC
Editor's Picks


- Market Data
Most Popular


