


 GBP/JPY Technical Outlook: Pound Gains Ground Amid Geopolitical Consolidation
  Ethereum’s $2,200 Ceiling: Can Diplomatic Breakthroughs Dissolve the Bearish Resistance?
  Ethereum Trails Bitcoin’s Retreat: Key Support Levels in Focus
  Dollar Dominance: USDCHF Defies Resistance Amid Greenback Surge
  FxWirePro- Major Crypto levels and bias summary
  AUDJPY Under Pressure: Bearish Technicals Signal Further Downside for the Aussie
  FxWirePro: USD/ZAR uptrend loses steam, remains on bullish path
  FxWirePro- Woodies Pivot(Major)


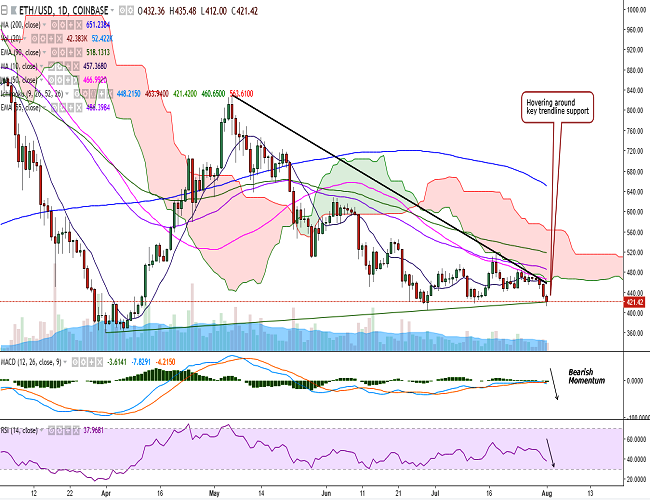
ETH/USD plunged to 412 levels as it breached trend line support joining 360 and 404.22.
The pair is down nearly 12 percent so far this week and is currently trading at 420 levels at the time of writing (Coinbase).
On the upside, resistance is seen at 448 (5-DMA) and a break above would see it testing 460 (cloud bottom)/486 (55-EMA)/500.
On the flipside, the pair is currently hovering around 420 (trend line joining 360 and 404.22) and a decisive break below would see it re-testing 400/ 360 (April 1 low).
Technical indicators are bearish on the daily chart – RSI is weak at 37 and stochs are at oversold levels with no major sign of reversal, and bearish MACD crossover below the zero line. Bias remains bearish on intraday charts as well.
Call Update: We recommended going short in our previous call. TP1 has been hit.
Recommendation: Book partial profits, stay short. SL:470. TP: 400/360.

- News

- Economy

- Central Banks
- Investing
- Research
- Roundups
- Digital Currency
- Insights
- Technical Analysis
- Technology
- Business
- Law
- Health
- Nature
- Fintech
- Science
- Topic
- Opinions
- ©Econometrics LLC . All Rights Reserved.
FxWirePro: ETH/USD struggles told trend line support at 420, stay short
Wednesday, August 1, 2018 10:56 AM UTC
Editor's Picks


- Market Data
Most Popular


