


 FxWirePro- Major Crypto levels and bias summary
  FxWirePro- Major Crypto levels and bias summary
  Ethereum Retreats in Bitcoin’s Shadow: ETH/USD Tests Critical Support at USD 2,075
  FxWirePro- Major Crypto levels and bias summary
  FxWirePro- Major Crypto levels and bias summary
  BTCUSD Coils in Tight Range: Will Geopolitical Stability Trigger a Breakout Toward $80,000?


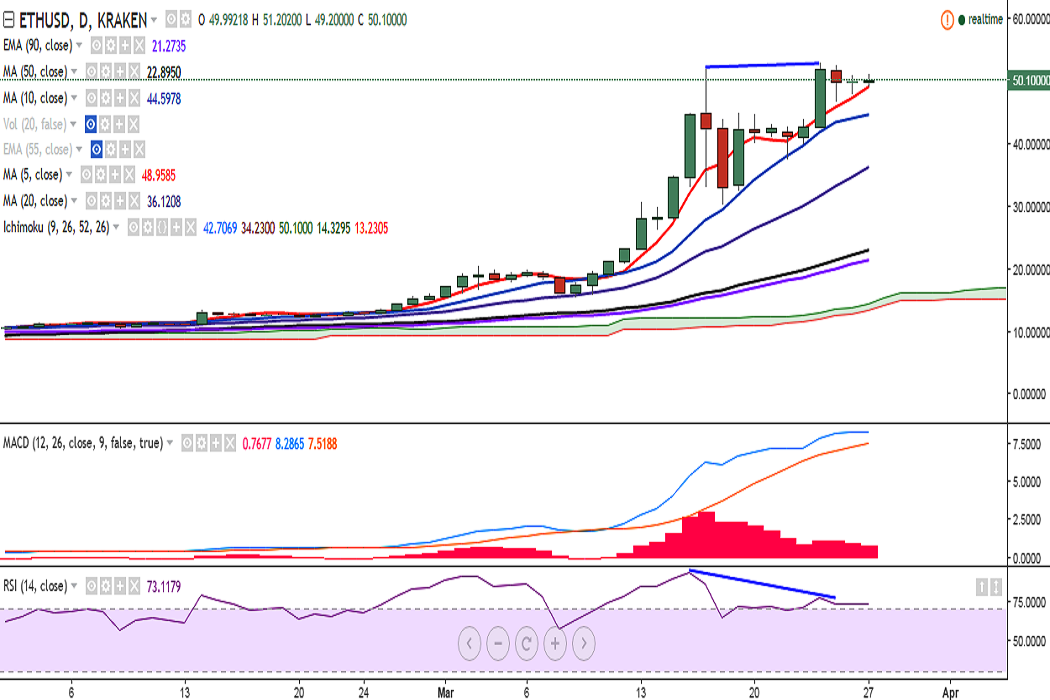
ETH/USD broke above the previous high of 51.90 levels and hit 52.89 levels on March 24. It is currently trading at 50 levels at the time of writing (Kraken).
Ichimoku analysis (Daily chart):
Tenkan-Sen: 41.60
Kijun-Sen: 34.17
The current back-to-back doji formations suggest indecisiveness in the market. On the upside, resistance is now seen at 52.89 (March 24 high) and a break above would target 55.43 (200% extension of 5.92 and 30.67 rally)/57.77(127.2% retracement of 51.90 and 30.30).
Bearish RSI divergence could be seen on daily charts. RSI(14) is currently in the overbought zone and a rollover coupled with a break below 47.18 (5-DMA) could see near-term bearish bias in the pair, and would target 43.84 (10-DMA)/37.60 (March 22 low).

- News

- Economy

- Central Banks
- Investing
- Research
- Roundups
- Digital Currency
- Insights
- Technical Analysis
- Technology
- Business
- Law
- Health
- Nature
- Fintech
- Science
- Topic
- Opinions
- ©Econometrics LLC . All Rights Reserved.
FxWirePro: ETH/USD rangebound, bearish RSI divergence suggests downside possibility
Monday, March 27, 2017 11:38 AM UTC
Editor's Picks


- Market Data
Most Popular


