


Ichimoku Analysis (4-Hour chart)
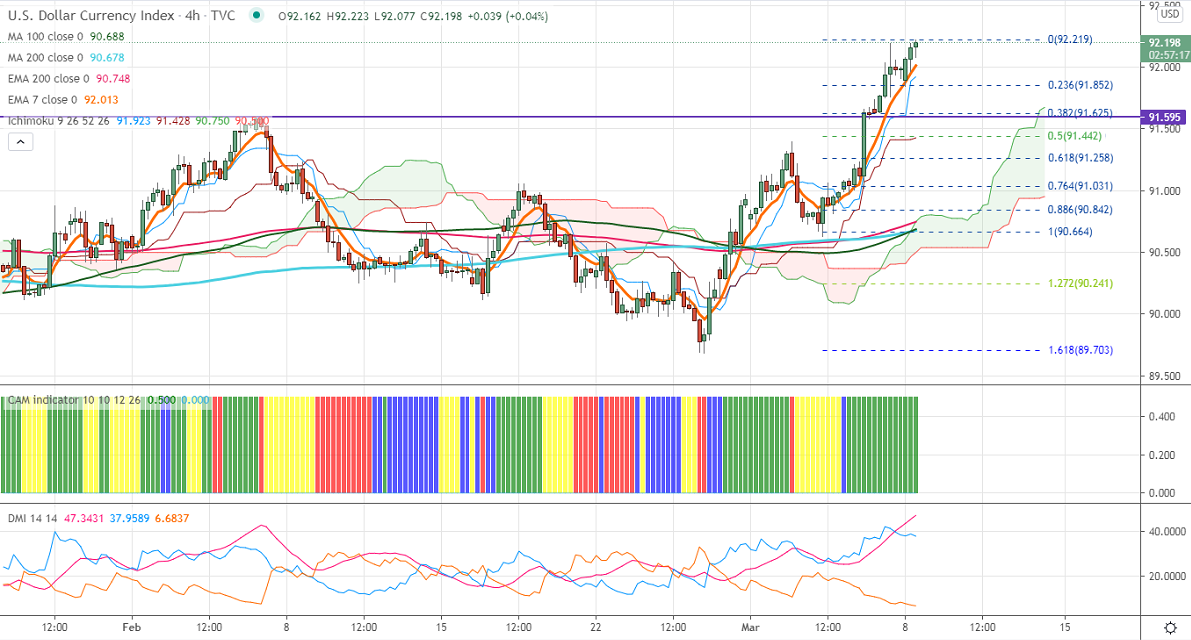
Tenken-Sen- 91.88
Kijun-Sen- 91.41
US Dollar index has once again declined after hitting a high of 92.195. The index has formed almost a double top around 92.20. The bond yield is trading higher for a sixth consecutive week and surged more than 65%. Any jump past 1.70% confirms trend continuation. The US economy has added 379k jobs in Feb much above expectations of 148k. The unemployment rate declined to 6.2% vs an estimate of 6.3%. Average hourly earnings came in line with an estimate at 0.2%.Jan 350% in the past 11 months on stimulus from US Fed. The index hits an intraday high of 92.195 and is currently trading around 92.136.
The near-term resistance is around 92.20 convincing close above confirms minor bullishness. A jump to 92.76 (161.8% fib)/93 is possible.
The index facing strong support at 91.85; any indicative break below will take the index to 91.40/90.75.
Indicator (4 Hour chart)
CAM indicator – Bullish
Directional movement index –Bullish
It is good to buy on dips around 92 with SL around 91.60 for a TP of 93.


