


 Mexico's Undervalued Equity Market Offers Long-Term Investment Potential
  Indonesia Surprises Markets with Interest Rate Cut Amid Currency Pressure
  Nasdaq Proposes Fast-Track Rule to Accelerate Index Inclusion for Major New Listings
  Urban studies: Doing research when every city is different
  Elon Musk’s Empire: SpaceX, Tesla, and xAI Merger Talks Spark Investor Debate
  S&P 500 Relies on Tech for Growth in Q4 2024, Says Barclays
  Wall Street Analysts Weigh in on Latest NFP Data
  BTC Flat at $89,300 Despite $1.02B ETF Exodus — Buy the Dip Toward $107K?


Crude oil price sentiments improved owing to progressively reassuring rhetoric from a number of OPEC nations willing to extend production cuts into H2’2017.
Despite recent bullish sentiments, the crude prices faltered between small gains and losses in European trading on Monday after reaching the strongest level in almost four weeks amid optimism that OPEC will extend its production cut deal beyond June.
As a result, both Brent and WTI Oil prices rose around 5% last week, the biggest weekly rise in 4-months, WTI crude May contract traded at $50.57 a barrel. It touched its highest since March 9th at $50.80.
Elsewhere, Brent crude for June delivery on the ICE Futures Exchange in London held firm at $53.52 a barrel by 08:10 GMT. The global benchmark hit $53.77 on Friday, the most since March 9th.
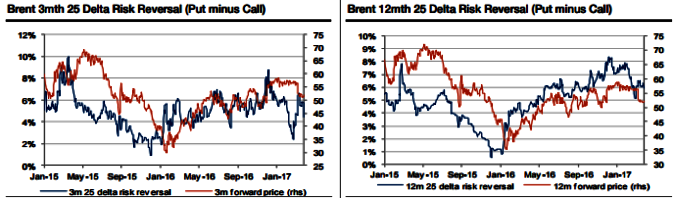
Consequently, crude oil risk-reversals have been rather volatile recently, especially for shorter maturities. For example, the Brent 3mth 25-delta risk reversal (put minus call) rose from 2.4% on 22 February to a peak of 6.7% on 10 March on the back of the abrupt five dollar drop in the Brent price. The Brent 3mth risk-reversal has subsequently eased somewhat to 4.4% while the Brent price has yet to recover.
Crude oil risk-reversals are normally measured as the implied vol of the put option minus the call option for the given delta. The convention is like this because the implied vols of put options have tended to be higher than for call options, which is mainly a reflection of higher producer option hedging activity (buying of puts/selling of calls) relative to consumer hedging activity.
The correlation between the Brent oil price and the risk-reversals have over recent years tended to be positive as should be clear from the charts below. The main reason has been because higher Brent prices have tended to result in more producer option hedging as producers were keen to lock-in the higher price.
However, the relationship between the crude oil price and risk-reversals has not been stable if we look further back in time. For example, the late 2014 OPEC meeting, which surprised the market with a policy u-turn, caused the correlation to turn negative as crude oil prices collapsed while the risk-reversals soared as producers scrambled to hedge themselves.
The Brent risk-reversals have over recent years made major trend reversals ahead of the Brent oil price: the 3mth risk-reversal peaked in early 2015 which was a few months before the Brent price; it bottomed in late 2014 which was again few months ahead of the oil price and the risk-reversal peaked in late 2016 which was well ahead of the recent sharp sell-off in crude oil prices.
Could the risk-reversal be a contrarian indicator when it makes major trend reversals? In other words, when the option market has significantly changed its ‘view’ on the likely future direction of the oil price, it seems to have a tendency to be proved wrong; although typically with a lag of several months.


