


 China’s Growth Faces Structural Challenges Amid Doubts Over Data
  Moody's Upgrades Argentina's Credit Rating Amid Economic Reforms
  Moldova Criticizes Russia Amid Transdniestria Energy Crisis
  Gold Prices Slide as Rate Cut Prospects Diminish; Copper Gains on China Stimulus Hopes
  S&P 500 Relies on Tech for Growth in Q4 2024, Says Barclays
  Indonesia Surprises Markets with Interest Rate Cut Amid Currency Pressure
  Global Markets React to Strong U.S. Jobs Data and Rising Yields
  UBS Predicts Potential Fed Rate Cut Amid Strong US Economic Data
  US Gas Market Poised for Supercycle: Bernstein Analysts
  Oil Prices Dip Slightly Amid Focus on Russian Sanctions and U.S. Inflation Data


Crude oil price is surging but we reckon no certain clarity on major trend which has been downtrend but has gone into consolidation phase from February 2016.
U.S. West Texas Intermediate (WTI) futures after briefly topping $50 per barrel, prices are tacked at $49.76 a barrel, up 1 cent as OPEC has sent hints that it could increase compliance with production cuts that began earlier this year.
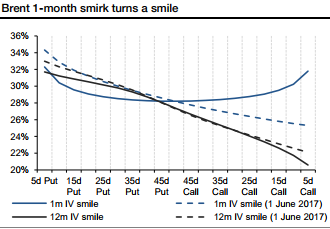
Front-month crude oil prices are currently trending higher, buoyed by robust seasonal product demand, and tentative evidence that OECD stocks may be drawing closer to their five-year average. On the back of this trend, short-dated option smirks have eased into balanced volatility smiles, while longer-dated options continue to meet sustained producer hedging (refer above chart). At -0.09%, Brent 1 month 25 delta risk-reversals (put minus call) are at their lowest since July 2014, but 12 months risk-reversals, at 6.09%, remain in line with their year-to-date average (6.30%).
For corporate crude oil producers, long-dated put skewness translates into higher hedging costs, which is ultimately bourne by their all-in cost of production. Currently, a crude oil producer can hedge its 2H18 production against WTI prices falling below $44.70 (90% of current 2H18 swap price) by selling away potential price gains above $53.70 (call strike which makes the 90% producer collar costless).
Given that the WTI 2H18 swap prices currently stand at $49.70, this implies a maximum downside exposure of $5.00 and a maximum upside of $4.00 per barrel for the hedging entity. The upside/downside ratio of the 90% producer zero-cost collar therefore currently stands at 0.80 times.
The above chart below plots the upside/downside ratios of producer zero-cost collars for different levels of put protection since January 2015. Despite what their names imply, zero-cost collars have an implied (or hidden) cost in the form of capped upside price potential.
Lower levels of upside/downside ratios suggest higher hedging costs in the form of greater forgone upside potential. This implied cost has decreased significantly since the December 2016 OPEC meeting (upside/downside ratio rising from approximately 0.60 times to 0.90 times between December and June), in line with the general decrease of long-dated put skewness (refer chart evidencing risk reversals).
However, with prices nearing and rising above $50/bbl for 2018, we expect the trend to reverse as producers seek to benefit from the current bearish respite by hedging their future production, which in turn should push risk reversals higher. Courtesy: Societe Generale.


