


COPPER chart - Trading View
Copper was trading 0.89% lower on the day at 2.8838 at around 11:10 GMT.
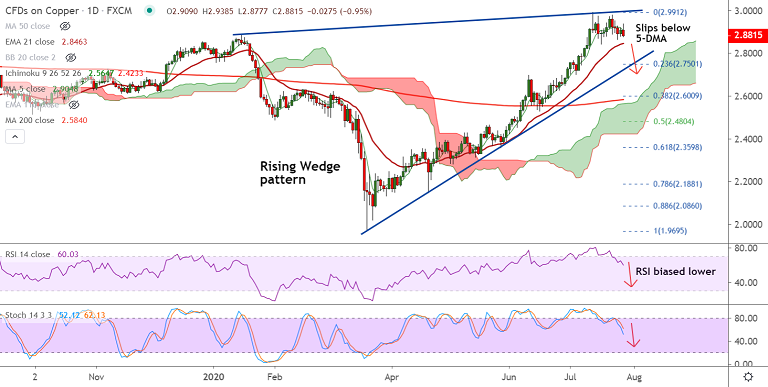
Prices failed to extend previous session's recovery and are set to extend downside.
Price action has slipped below 5-DMA support and a 'Bearish Divergence' on RSI and Stochastics on the daily chart are likely to drive further weakness.
Stochs and RSI are showing a bearish rollover from over bought levels and are biased lower.
5-DMA has turned and bearish MACD crossover on signal line adds to the bearish pressure.
Next major support lies at 21-EMA at 2.8465. Break below required for further downside.
Support levels - 2.8465 (21-EMA), 2.6979 (55-EMA)
Resistance levels - 2.9044 (5-DMA), 3.0046 (Upper W BB)


