


COPPER chart - Trading View
Copper was trading 1.10% lower on the day at 3.988 at around 11:35 GMT, extending previous session's weakness.
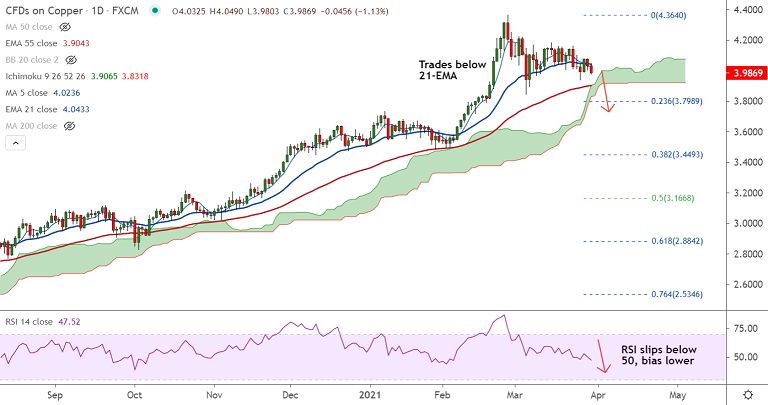
Price action has failed to extend recovery above 21-EMA which is now turned stiff resistance at 4.043.
The pair is grinding lower for the 3rd straight week, technical studies keep scope for further downside.
5-week MA has turned South and price action has slipped below 200H MA on the intraday charts.
Oscillators show bearish momentum and RSI is below 50 which supports bearish momentum.
Bears now eye next major support at 3.904 (nearly converged 55-EMA and daily cloud top).
Major trend still remains bullish. Breach below cloud will change near-term dynamics.
Support levels - 3.904 (nearly converged 55-EMA and daily cloud top), 3.798 (23.6% Fib)
Resistance levels - 4.043 (21-EMA), 4.061 (200H MA), 4.084 (5-week MA)


