


COPPER chart - Trading View
Copper was trading 1.76% higher at 3.196 at around 12:45 GMT, bias strongly bullish.
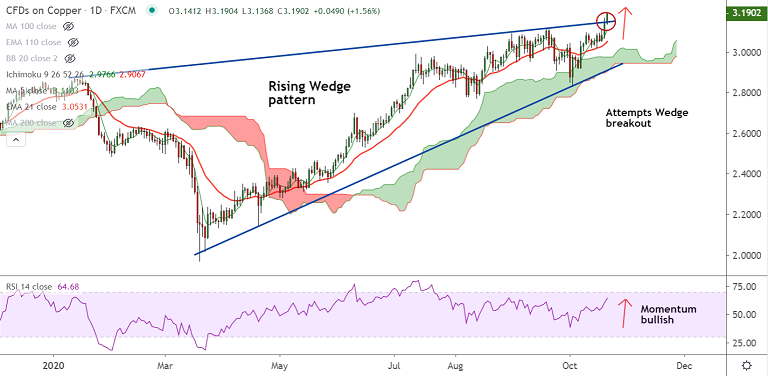
The price of copper has hit fresh multi-month highs, trades at levels unseen since July 2018.
Price action has bounced off cloud support and is attempting a breakout above rising Wedge pattern.
Volatility is rising as evidenced by widening Bollinger bands. GMMA indicator shows major and minor trend are strongly bullish.
Momentum indicators are bullish. RSI is above 60 mark and support uptrend. CCI also support upside.
Pair finds little resistance on the upside. Weak dollar is likely to push prices higher. Scope for test of 3.31 levels.


