COPPER chart - Trading View
Technical Analysis: Bias Bearish
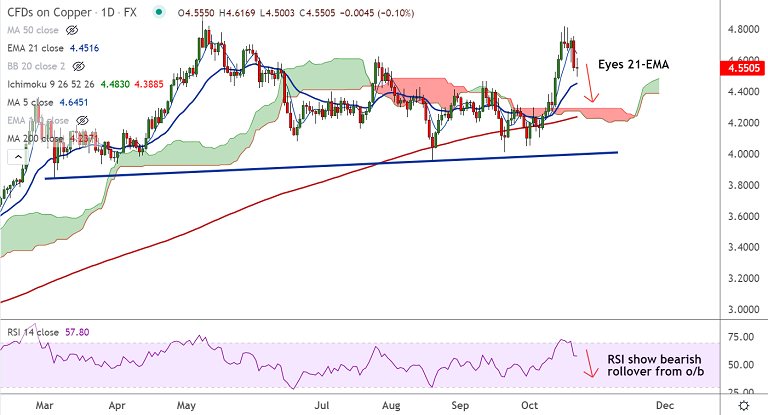
- Copper was trading 0.22% lower on the day at 4.5473 at around 13:00 GMT
- Price action is extending previous session's slump, more weakness on cards
- RSI shows bearish rollover from overbought levels
- 5-DMA has turned, the pair has slipped below 200H MA
- GMMA indicator has shown a bearish shift on the intraday charts
Support levels - 4.451 (21-EMA), 4.388 (20-DMA), 4.362 (55-EMA)
Resistance levels - 4.597 (200H MA), 4.643 (5-DMA), 4.809 (Upper BB)
Summary: Copper poised for more weakness. Dip till 21-EMA likely. Breach below to see more downside.


FxWirePro- Major Crypto levels and bias summary
Aussie-Yen Holds Firm Post-BOJ Rate Boost: Intraday Bullish Momentum Intact
FxWirePro- Major Pair levels and bias summary
FxWirePro: GBP/NZD retreats slightly but trend is still bullish
FxWirePro- Major European Indices
FxWirePro: USD/JPY firms as Japanese Yen weakens after BoJ rate hike
GBPJPY Rockets Post-BOJ Hike: Bullish Surge to 210 in Sight – Buy Dips Targeting 212
EURJPY Surges Post-BOJ Hike: Bullish Momentum Builds – Buy Dips Targeting 185
FxWirePro- Major Pair levels and bias summary
FxWirePro: USD/CAD downtrend slows, but bearish sentiment remains
FxWirePro: GBP/NZD attracts buying interest, 38.2% fib eyed
FxWirePro- Woodies Pivot(Major)
FxWirePro: EUR/AUD runs out of steam but maintains bullish outlook
FxWirePro: USD/CNY neutral in the near-term, scope for downward resumption
FxWirePro: AUD/USD bulls struggle to hold on US CPI induced gains 


