COPPER chart - Trading View
Copper was trading 0.20% lower on the day at 4.6538 at around 15:50 GMT.
Stronger dollar weighed on the commodities market, dragging copper price lower.
The pair hit session lows at 4.5893 before paring losses and edging higher.
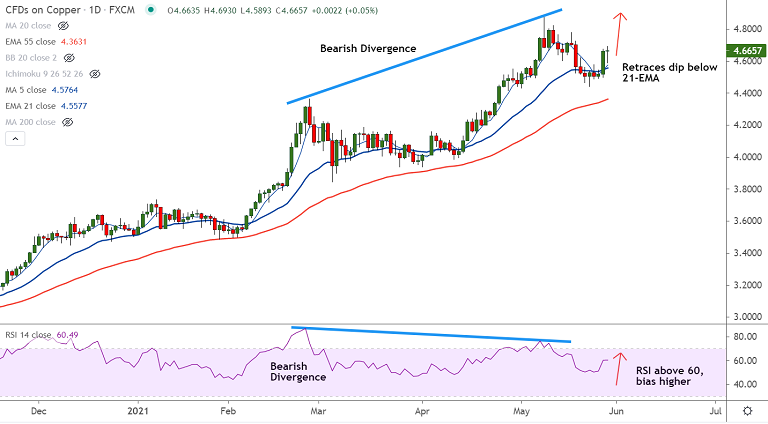
Bearish RSI divergence led dip found support at 21-EMA. RSI has turned bullish above 60 mark.
Copper prices have retraced a brief dip below 21-EMA and have edged above 5-DMA.
GMMA indicator shows major trend is strongly bullish and minor trend is turning bullish.
Copper price are set to resume upside after brief pullback. Retest of yearly highs at 4.8857 likely.


FxWirePro- Major Pair levels and bias summary
FxWirePro- Major Crypto levels and bias summary
FxWirePro-Major European Indices
FxWirePro: USD/CAD slips as oil rally boosts loonie
FxWirePro: EUR/NZD runs out of steam but maintains bullish outlook
ETHUSD Dip: Prime Buy Zone to $3600 Targets
NZDJPY: Bearish Signals Sell-on-Rally Opportunity Below 92
211.55 Ceiling Holds: GBPJPY Profit-Taking Turns Bearish
FxWirePro: USD/CAD outlook weaker on renewed downside pressure
FxWirePro: GBP/AUD loses momentum but bullish setup remains
FxWirePro: GBP/USD advances on steady UK GDP growth
Pound Strike Forces EURGBP Retreat – Next Stop 0.8660?
FxWirePro: USD/ZAR down trend loses steam, remains on bearish path
FxWirePro: USD/JPY extends fall as yen rises on intervention fears
FxWirePro: EUR/AUD uptrend loses steam, remains on bullish path
AUDJPY: Buy-the-Dip Strategy Intact Above 103.80 Despite Profit-Taking Pullback
FxWirePro- Major Pair levels and bias summary 


