


Copper chart - Trading View
Copper was trading rangebound on the day at 2.453 at around 10:50 GMT.
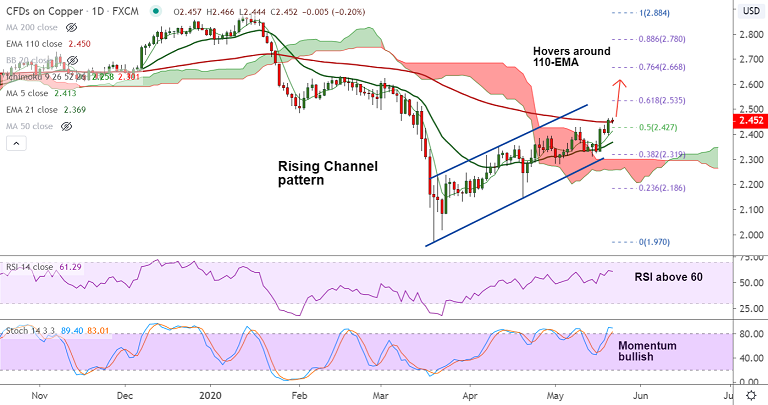
Price action hovers around 110-EMA as the pair consolidates previous session's gains.
GMMA indicator shows near-term moving averages have edged above long-term moving averages.
Momentum studies are bullish and volatility is high. ADX and MACD also support gains.
Decisive break above 110-EMA could buoy price. Next bull target aligns at 61.8% Fib at 2.535.
On the flipside, rejection at 110-EMA could see dip till 55-EMA. Break below 21-EMA negates bullish bias.
Support levels - 2.413 (5-DMA), 2.377 (55-EMA), 2.369 (21-EMA)
Resistance levels - 2.450 (110-EMA), 2.535 (61.8% Fib), 2.561 (200-DMA)


