


Copper chart - Trading View
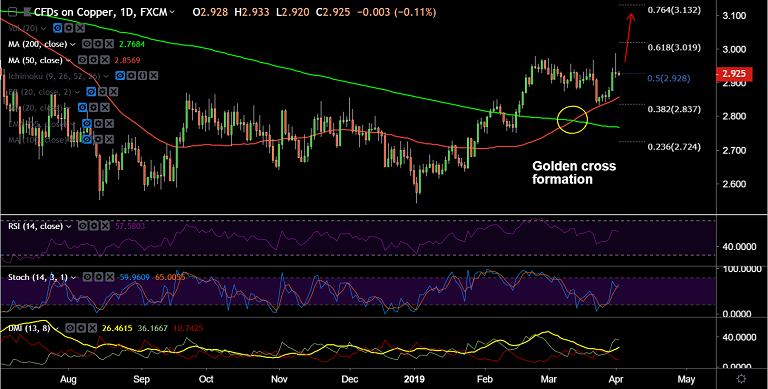
- Copper hit 9-month highs at 2.986 on Monday's trade before paring most of the gains to close at 2.928.
- The commodity has been extending rangebound trade on the day, hovering around 50% Fib (2.928) at 0340 GMT.
- Technical studies support further uoside in the pair. Stochs and RSI are biased higher.
- A 'Golden Cross' formation on the daily charts keeps scope for further upside. Next major bull target would be 61.8% Fib at 3.019.
- On the flipside, strong support lies at 50-DMA at 2.857. Break below could see weakness till 200-DMA (currently at 2.768).
Call update: Our previous call (https://www.econotimes.com/FxWirePro-Copper-extends-gains-on-US-China-trade-talk-hopes-low-inventories-1518391) has hit all targets.
For details on FxWirePro's Currency Strength Index, visit http://www.fxwirepro.com/currencyindex.


