COPPER chart - Trading View
Copper edges higher from fresh 3-week lows at 4.44 hit earlier on the day and was trading at 4.4937 at around 11:00 GMT.
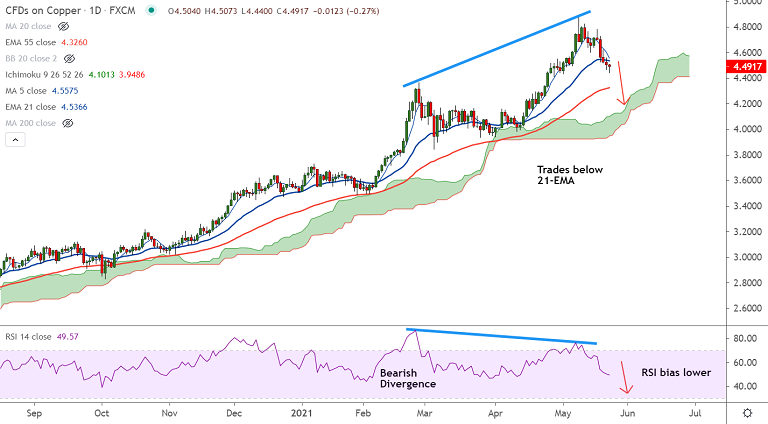
Price action has slipped below 21-EMA and a bearish 5-DMA crossover on 20-DMA adds to bearish bias.
MACD supports downside with a bearish crossover on signal line. Price action is below 200H MA.
Momentum indicators are bearish. Stochs and RSI are biased lower and RSI has slipped below 50 mark.
'Bearish RSI Divergence' on the daily charts adds to the downside pressure. Scope for further weakness.
Major trend still remains bullish. Copper price are on track to test 55-EMA at 4.3260. Further weakness only on break below.


Bitcoin Stuck in No-Man’s-Land: $85K Dip or $100K Breakout Next?
FxWirePro: AUD/USD firms on hawkish RBA meeting minutes
0.7870 Break Looms – Next Stop 0.7800 for USDCHF?
FxWirePro: EUR/AUD slips following RBA minutes , plunge to test a key fibo grows
FxWirePro: USD/CAD slips as oil rally boosts loonie
Pound Strike Forces EURGBP Retreat – Next Stop 0.8660?
AUDJPY: Buy-the-Dip Strategy Intact Above 103.80 Despite Profit-Taking Pullback
FxWirePro: GBP/AUD tracks lower on firmer Australian dollar
FxWirePro: GBP/AUD loses momentum but bullish setup remains
FxWirePro: GBP/USD advances on steady UK GDP growth
FxWirePro- Major Pair levels and bias summary
ETHUSD Dip: Prime Buy Zone to $3600 Targets
FxWirePro: GBP/NZD bulls loosen their grip a bit, dips to be bought
FxWirePro: EUR/NZD downside pressure builds, key support level in focus
211.55 Ceiling Holds: GBPJPY Profit-Taking Turns Bearish
FxWirePro- Woodies Pivot(Major)
FxWirePro: EUR/CAD slips as firm oil price lift loonie despite soft GDP data 


