


COPPER chart - Trading View
Technical Analysis: Bias Bearish
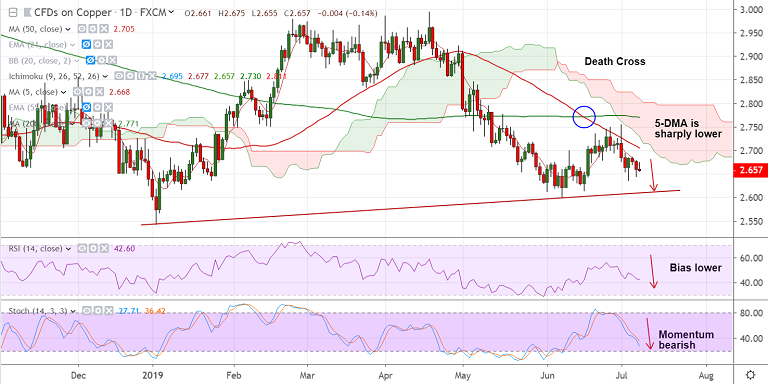
Daily Chart:
- Price action rejected at session highs at 2.675, bias bearish
- 5-DMA is sharply lower, upside capped at 50-DMA
- 'Death Cross' - bearish 50-DMA crossover on 200-DMA
- Stochs and RSI sharply lower, RSI below 50
- GMMA shows major trend is bearish
2H Chart:
- Capped below 2H 200 SMA, Bearish inverted hammer at 55-EMA
- Price action below cloud and 'Death Cross' formation
Weekly Chart:
- Strong support seen at 200W SMA (currently at 2.635)
- Price action sandwiched between 50 and 200 SMA, breakout will provide clear direction
Support levels - 2.635 (200W SMA), 2.599 (June 7 low), 2.542 (Jan 3rd low)
Resistance levels - 2.668 (5-DMA), 2.684 (21-EMA and 20-DMA), 2.721 (55-EMA)
For details on FxWirePro's Currency Strength Index, visit http://www.fxwirepro.com/currencyindex.


