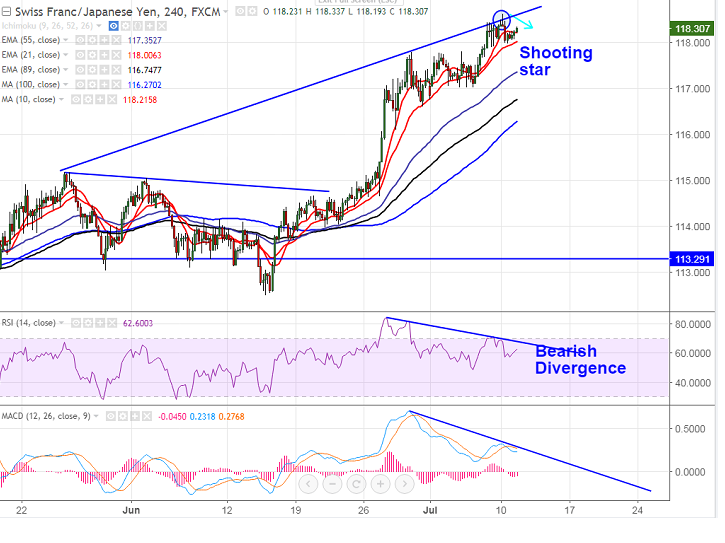
- Candlestick pattern formed – Shooting star (4 hour chart).
- The pair has shown a trend of bullishness for the past one month from the low of 112.58 made on Jun 14th 2017. It hits high of 118.60 yesterday and is currently trading around 118.30.
- Technically the pair is facing major support around 117.80 (4H Kijun-Sen) and any break below confirms minor weakness. Any break below will drag the pair down till 117.30/116.22 (100- 4H MA).
- In the 4H chart, the pair has formed bearish divergence in RSI and MACD. So a minor dip till 117.30 is possible.
- On the higher side, 118.60 will be acting as major resistance and any break above will take the pair till 119.25/120 in the short term.
It is good to sell on rallies around 118.55-118.60 with SL around 119.25 for the TP of 117.80/117.30


FxWirePro: EUR/NZD set for bigger drop, but close below key fibo needed
FxWirePro- Woodies Pivot(Major)
FxWirePro: GBP/AUD tracks lower on firmer Australian dollar
FxWirePro: AUD/USD gaining momentum for a move towards 0.6800 level
CAD/JPY Holds Positive Bias Despite Canada’s Sharp GDP Contraction: Buy Dips Toward 116 Target
EUR/GBP Holiday Slumber: Bearish Bias Intact Below 0.8800 Resistance
FxWirePro: USD/CAD dips below lower range, bearish bias increases
FxWirePro: USD/CNY hits 15-month low , scope for further downside
USD/CHF Bears in Control: Dips Below 0.7870 Signal More Downside Ahead
FxWirePro- Major Crypto levels and bias summary
FxWirePro- Major Pair levels and bias summary
FxWirePro: EUR/AUD slips following RBA minutes , plunge to test a key fibo grows
FxWirePro- Major Pair levels and bias summary
NZDJPY: Sell the Rallies as Bears Guard 92 and Range Trade Persists
FxWirePro: USD/ZAR outlook weaker on renewed downside pressure 


