


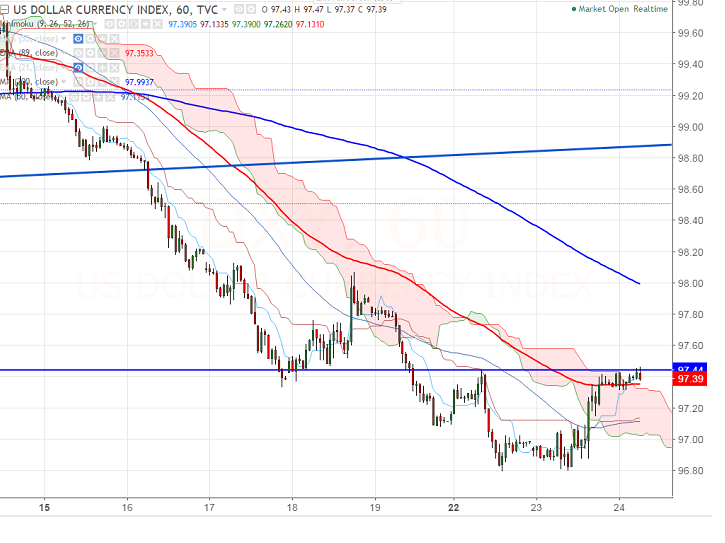
- US Dollar index shown minor jump after forming a temporary bottom around 96.80. It is currently trading around 97.45. Intraday trend is bullish as long as support 97.03 (Hourly Tenkan-Sen) holds.
- The index has shown a huge decline from the high 103.82 and downside capped by 61.8% fibo at 96.40 and bearish continuation can be seen below that level. Short term trend is still weak as long as resistance 99.89 (May 11th 2017 high) holds.
- The near term resistance is around 97.45 (89 W EMA) and any break above will take the index till 98.60 (support turned into resistance)/ 99.25 (200 MA)/99.89.
- On the lower side, major near term support is around 96.40 (61.8% fibo) and any break below will drag the index till 95.91 (Nov 9th 2016 low)/95.
It is good to buy above 97.45 with SL around 97 for the TP of 98.60.


