


After confronting major obstacle (the stiff resistance of $10,000 level), bitcoin began plummeting price against the US Dollar. Although BTCUSD (at Coinbase) brokedown the crucial support of $9,500 level (i.e. 21-DMAs).
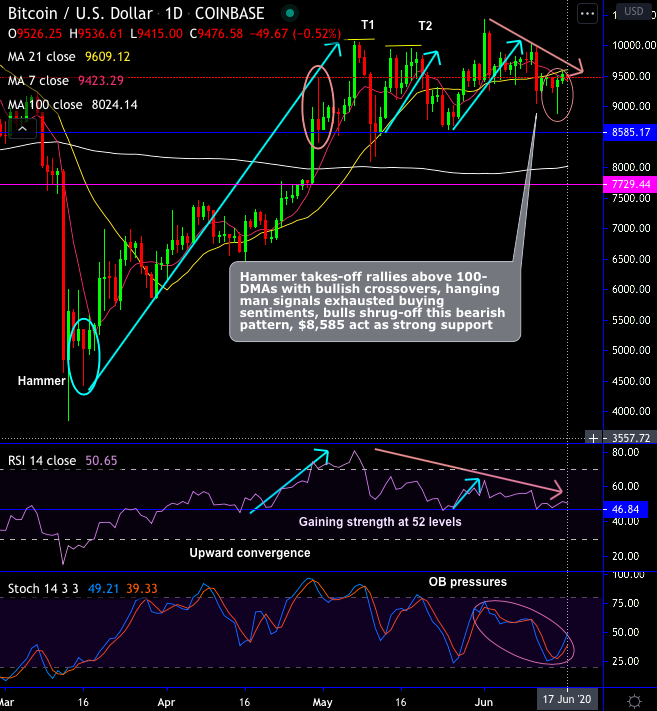
Technically, hanging man pops-up at $9,427 (i.e. well below DMA levels). Prior to which, hammer takes-off rallies above 100-DMAs with bullish crossovers, bullish engulfing signals intensified buying sentiments as minor trend breaks-out stiff resistance, bulls shrug-off double top pattern, $8,585 act as strong support (1st chart).
Shooting star pops up at peaks of rallies to indicate the exhaustiveness in the prevailing bull-run (refer 2nd chart). It broke many supports and even dived below the $9,060 pivot level. Finally, it found support near the $8,900 level and a low is formed near $8,897. The price started a strong recovery wave from the $8,897 low and climbed back above the $9,330 resistance zone.
From April'16, the BTC has spiked from $414 to the all-time highs of $19k, currently, trading at $ 7.3k mark, which is still 1,660% rallies.
As we could foresee more upside risks in the days to come with the strong support of $7,950 levels (i.e. 100-DMAs), long hedges have already been advocated using CME BTC Futures when the underlying BTC was trading at $4,927 levels, and we wish to uphold the same positions with June months deliveries. It is unwise to keep speculating on the next upside target and accumulate fresh bitcoins. Instead, one can certainly uphold the above advocated long hedges for now (spot reference: 9,472 levels).


