


Ichimoku analysis (Daily chart)
Tenken-Sen- $54800
Kijun-Sen- $55942
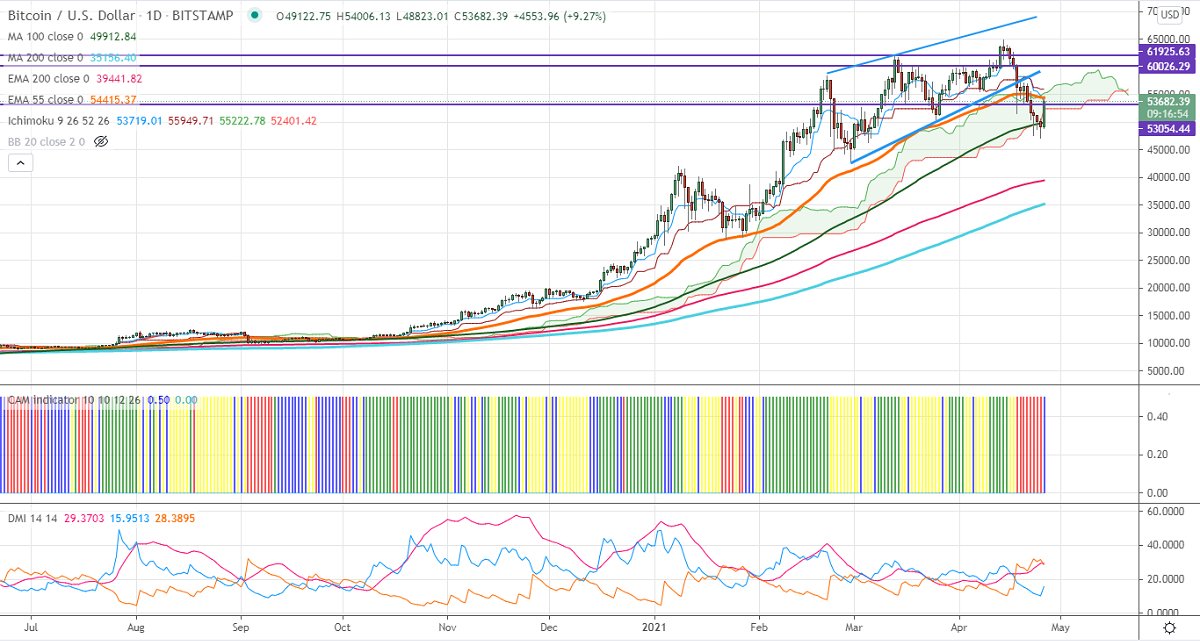
BTCUSD has formed double bottom around $47000 and shown a massive recovery. The digital asset has shown a massive sell-off after hitting a fresh all-time high of $64843. It fell below 100- day MA around $49736 for the first time this year. The overall trend is still bearish as long as resistance $64850 holds. The intraday trend is bullish and is holding above 200-H MA. It hits an intraday low of $54006 and is currently trading around $53570.
The near-term resistance is around $54000 (38.2% fib). Any indicative break above targets $5500/$56000. Major trend continuation above $65000.
The pair's minor support is around $49730.A break below will drag the pair down till $47000/$43000 is possible. Significant bearishness only if it breaks $43000.
Indicator (Daily chart)
CAM indicator –Bearish
Directional movement index – Bearish
It is good to sell on rallies around $54500-550 with SL around $56000 for TP of $43000.


