


Ichimoku analysis (4-hour chart)
Tenken-Sen- $49055
Kijun-Sen- $49166
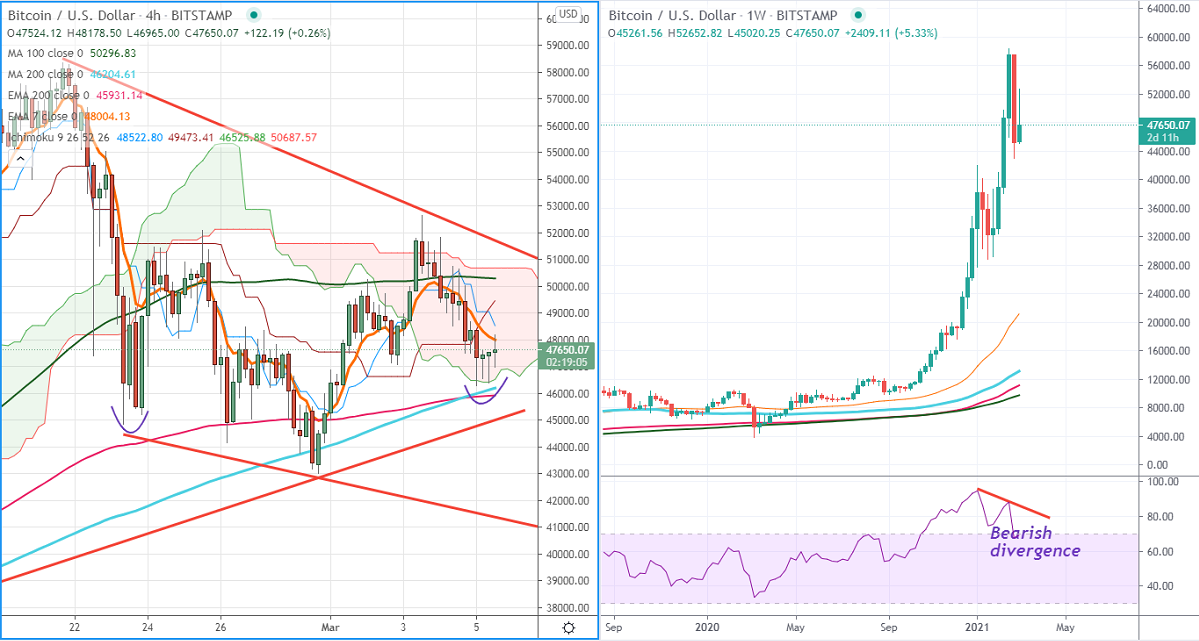
Chart pattern- Bearish divergence (Weekly chart RSI)
BTCUSD performed extremely well this year and surged more than 75%. It hits a fresh all-time high at $58354. The pair lost more than $15000 on profit booking and strong US dollar. In the weekly chart, it has formed bearish divergence in the RSI chart. This shows a minor weakness a dip to $41380 (trend line joining $44854 and $43021) is possible. The support to be watched is $45900 - $46130 (200 -4H EMA and MA). Any violation below targets $44845/$43000/$41380.
The pair recovered to $52652 slightly above 61.8% retracement of $58354 and $43021.Any further bullishness can be seen if it breaks above that level. A jump till $56400 (161.8% fib)/$62300 (127.2% fib) is possible.
It is good to sell on rallies around $50000 with SL around $51800 for TP of $41500.


