


 FxWirePro- Major Crypto levels and bias summary
  Ethereum’s $2,200 Ceiling: Can Diplomatic Breakthroughs Dissolve the Bearish Resistance?
  Bitcoin Retreats as Geopolitical Tensions Flare: BTC/USD Dips Following Iran’s Rejection of Ceasefire
  Ethereum Retreats in Bitcoin’s Shadow: ETH/USD Tests Critical Support at USD 2,075
  BTCUSD Coils in Tight Range: Will Geopolitical Stability Trigger a Breakout Toward $80,000?
  FxWirePro- Major Crypto levels and bias summary


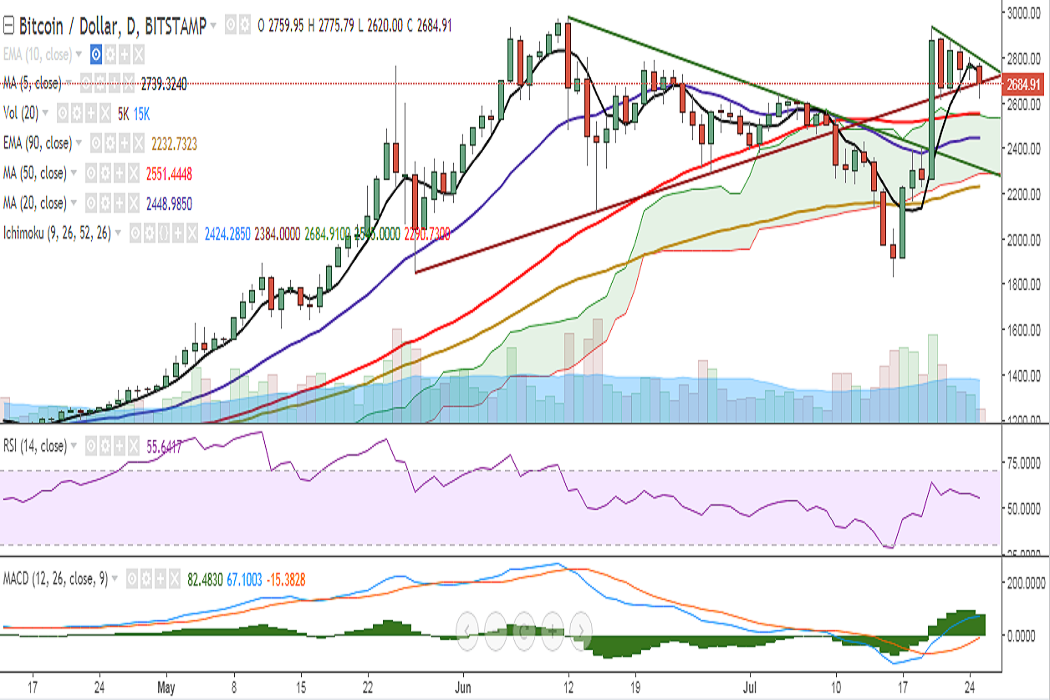
BTC/USD broke below trend line joining 1850 and 2120 levels and hit 2620 levels. It is currently trading at 2685 levels at the time of writing (Bitstamp).
Ichimoku analysis of daily chart:
Tenkan Sen: 2424.28
Kijun Sen: 2384
On the upside, immediate resistance is seen at 2733 (78.6% retracement of 2980 and 1830) and a break above would target 2790 (trend line joining 2938 and 2882)/2849 (4h upper Bollinger). Further strength would see it testing 2938 (July 20 high)/ 2980 (June 12 high).
On the reverse side, a close below 2690 (trend line joining 1850 and 2120) would drag the pair to 2614 (2h 90-EMA)/2551 (50-DMA)/2450 (20-DMA). Further weakness would drag it to 2312 (trend line joining 2980 and 2639)/2290 (Cloud bottom).
Momentum studies: On the daily chart, RSI is 55 with slightly lower bias, and Stochs are on the verge of a rollover from the overbought zone. Also, 5-DMA is showing a turn. RSI falling below 50, along with the rollover of stochs, would confirm minor bearishness in the pair.
Bias appears bearish on the 4-hour chart with MACD line below the signal line, RSI below 50 and stochs biased lower. Bias appears weak on 1- and 2-hour charts as well.
Recommendation: Good to go short on rallies around 2700. SL: 2790. TP: 2551.
FxWirePro launches Absolute Return Managed Program. For more details, visit http://www.fxwirepro.com/invest

- News

- Economy

- Central Banks
- Investing
- Research
- Roundups
- Digital Currency
- Insights
- Technical Analysis
- Technology
- Business
- Law
- Health
- Nature
- Fintech
- Science
- Topic
- Opinions
- ©Econometrics LLC . All Rights Reserved.
FxWirePro: BTC/USD upside capped by strong trend line resistance, good to sell on rallies
Tuesday, July 25, 2017 9:16 AM UTC
Editor's Picks


- Market Data
Most Popular


