


 FxWirePro- Major Crypto levels and bias summary
  FxWirePro- Major Crypto levels and bias summary
  BTCUSD Coils in Tight Range: Will Geopolitical Stability Trigger a Breakout Toward $80,000?
  Ethereum Trails Bitcoin’s Retreat: Key Support Levels in Focus
  FxWirePro- Major Crypto levels and bias summary
  Ethereum Retreats in Bitcoin’s Shadow: ETH/USD Tests Critical Support at USD 2,075


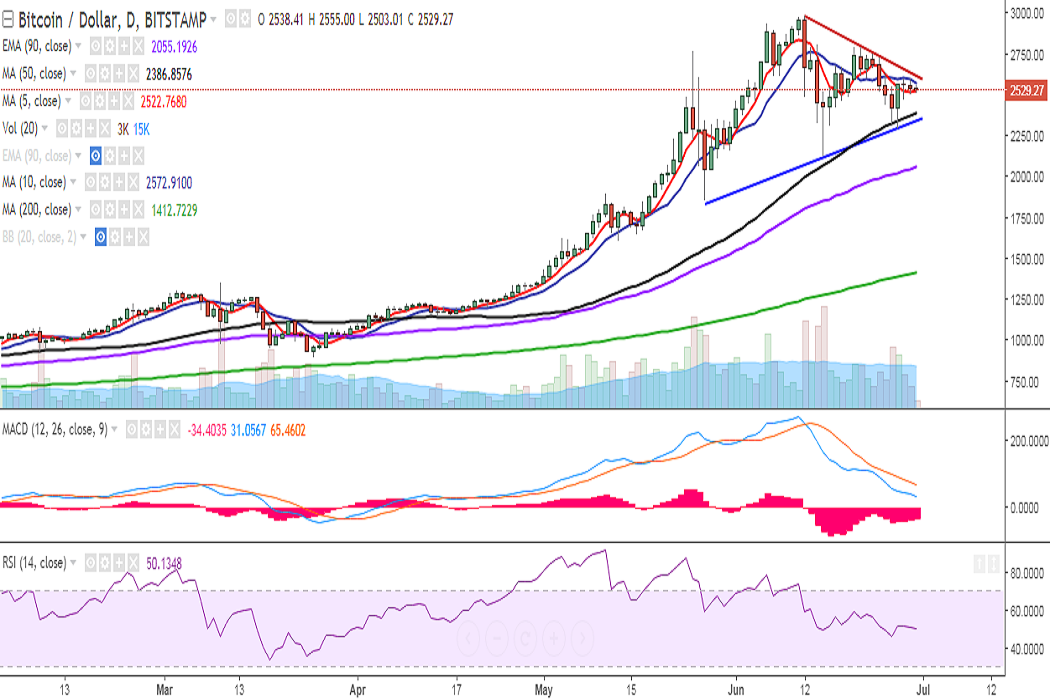
BTC/USD continues trading in a narrow range on Friday as it tries to hold above 5-DMA. It is currently trading at 2524 levels at the time of writing (Bitstamp).
Ichimoku analysis of daily chart:
Tenkan Sen: 2518
Kijun Sen: 2550
The pair is trading in a symmetric triangle pattern, with upside capped by strong trend line resistance and downside capped by trend line support.
On the upside, immediate resistance is seen at 2572 (10-DMA) and a break above would target 2594 (20-DMA)/2605 (trend line joining 2980 and 2789). A consistent break above the trend line resistance would see further upside in the pair, targeting 2651 (61.8% retracement of 2980 and 2120)/ 2682 (78.6% retracement of 2789 and 2291)/ 2760 (May 25 high)/2789 (June 21 high).
On the downside, a break below 2522 (5-DMA) would see a dip till 2495 (2h 50-SMA)/ 2415 (50% retracement of 1850 and 2980). Further weakness would drag it to 2386 (50-DMA)/ 2334 (trend line joining 1850 and 2120).
Momentum studies: On the daily chart, RSI is at 50, while the MACD line is below the signal line, with waning downward momentum. Stochs also appear to be biased lower.
On the weekly chart, the pair continues to trade below 5-SMA. The MACD line is above the signal line. RSI is holding at 72 and stochs are on the verge of a rollover from the overbought levels.
Overall bias appears neutral for the moment. Traders are preferred to wait for the breach of major levels before taking a call.
Recommendation: Wait for clear directional bias.
FxWirePro launches Absolute Return Managed Program. For more details, visit http://www.fxwirepro.com/invest


