


 Ethereum Retreats in Bitcoin’s Shadow: ETH/USD Tests Critical Support at USD 2,075
  BTCUSD Coils in Tight Range: Will Geopolitical Stability Trigger a Breakout Toward $80,000?
  FxWirePro- Major Crypto levels and bias summary
  Bitcoin Retreats as Geopolitical Tensions Flare: BTC/USD Dips Following Iran’s Rejection of Ceasefire
  FxWirePro- Major Crypto levels and bias summary
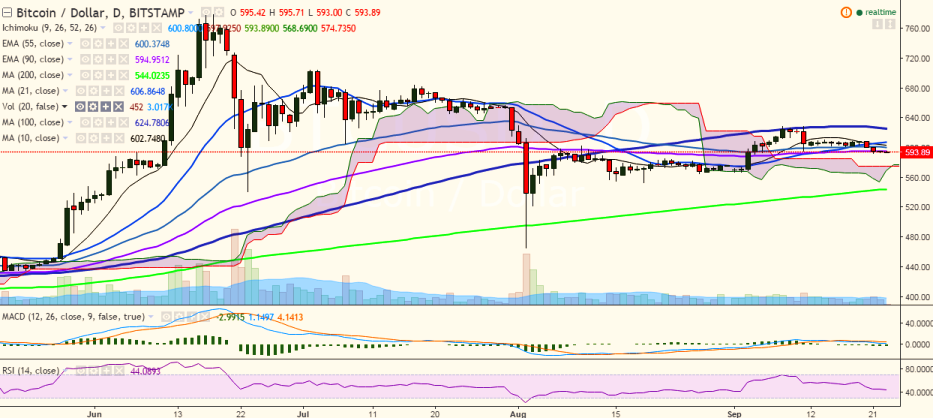


BTC/USD is trading flat on Friday and struggling to break below 90 EMA. It is currently trading at 595.07 levels (Bitstamp).
Long-term trend: Bullish
Short-term trend: Bearish
Ichimoku analysis of daily chart:
Tenkan Sen: 601.39
Kijun Sen: 597.89
Trend reversal: 594.97 (90 EMA)
“The pair is trading below both Tenkan Sen and Kijun Sen. This, along with the crossover of 10- and 21-DMA suggests a short-term bearish trend in the pair. A dip till 550 is on the cards”, FxWirePro said in a statement.
BTC/USD faces immediate resistance at 600 (55 EMA) and a break above would target 610 levels (psychological)/ 628 (September 11 high).
On the flipside, support is seen at $550 levels (psychological) and a break below would drag the pair to 542.17 (200-day MA)/527 (61.8% retracement of 465.28 and 628.99).

- News

- Economy

- Central Banks
- Investing
- Research
- Roundups
- Digital Currency
- Insights
- Technical Analysis
- Technology
- Business
- Law
- Health
- Nature
- Fintech
- Science
- Topic
- Opinions
- ©Econometrics LLC . All Rights Reserved.
FxWirePro: BTC/USD struggles to break below 90-EMA, good to sell on rallies
Friday, September 23, 2016 7:19 AM UTC
Editor's Picks


- Market Data
Most Popular


