


 FxWirePro- Major Pair levels and bias summary
  Bitcoin Retreats as Geopolitical Tensions Flare: BTC/USD Dips Following Iran’s Rejection of Ceasefire
  FxWirePro- Woodies Pivot(Major)
  FxWirePro- Major Crypto levels and bias summary
  FxWirePro: GBP/USD drifts lower , could be on verge of bigger drop
  FxWirePro- Major Crypto levels and bias summary
  Ethereum Retreats in Bitcoin’s Shadow: ETH/USD Tests Critical Support at USD 2,075
  FxWirePro: EUR/NZD positions for another climb, eyes 2.0100 level
  FxWirePro: USD/JPY edges higher but bulls lack punch
  FxWirePro- Major Crypto levels and bias summary
  AUDJPY Under Pressure: Bearish Technicals Signal Further Downside for the Aussie


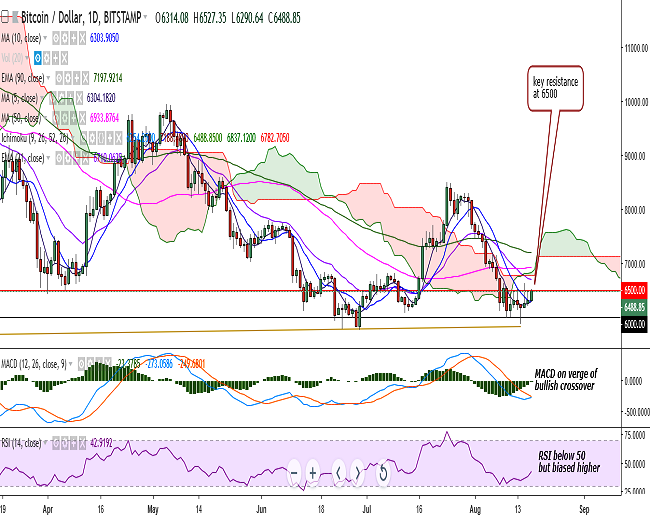
(Refer BTC/USD chart on Trading View)
BTC/USD is trading in the green on Friday as it is holding its strength well above 10-DMA.
The pair is currently hovering around 6500 levels at the time of writing (Bitstamp).
On the upside, a consistent break above 6500 would see the pair testing 6628 (4h 90-EMA)/6711 (21-EMA). Further strength would target 6782 (Cloud bottom)/6870 (20-DMA).
On the downside, support is likely to be found at 6380 (1h 50-SMA) and any violation would drag it to 6287 (2h 50-SMA)/6200. Further weakness would test 6120 (June 13 low)/6000/5920 (February 06 low).
On the daily chart, the pair is hovering around key psychological levels of 6500. Stochs have rolled over from oversold levels, MACD appears to be on the verge of a bullish crossover, RSI is below 50 with upward bias. Intraday bias is bullish at the time of writing.
A decisive break above 6500 levels, along with other bullish indicators, could see further jump in the pair. Further bullishness would be confirmed only on a break above cloud.

- News

- Economy

- Central Banks
- Investing
- Research
- Roundups
- Digital Currency
- Insights
- Technical Analysis
- Technology
- Business
- Law
- Health
- Nature
- Fintech
- Science
- Topic
- Opinions
- ©Econometrics LLC . All Rights Reserved.
FxWirePro: BTC/USD hovers around 6500, decisive break above to see further upside
Friday, August 17, 2018 7:30 AM UTC
Editor's Picks


- Market Data
Most Popular


