


 Bitcoin Retreats as Geopolitical Tensions Flare: BTC/USD Dips Following Iran’s Rejection of Ceasefire
  Ethereum Trails Bitcoin’s Retreat: Key Support Levels in Focus
  NZDJPY Technical Outlook: Bearish Momentum Gains Traction as Kiwi Weakens
  FxWirePro: USD/JPY edges higher but bulls lack punch
  Bitcoin Retreats Toward Critical Support as Geopolitical Winds Shift
  FxWirePro: USD/ZAR uptrend loses steam, remains on bullish path
  FxWirePro: GBP/USD drifts lower , could be on verge of bigger drop
  AUDJPY Under Pressure: Bearish Technicals Signal Further Downside for the Aussie
  FxWirePro- Woodies Pivot(Major)
  FxWirePro- Major Pair levels and bias summary
  FxWirePro- Major Pair levels and bias summary
  FxWirePro- Major Crypto levels and bias summary


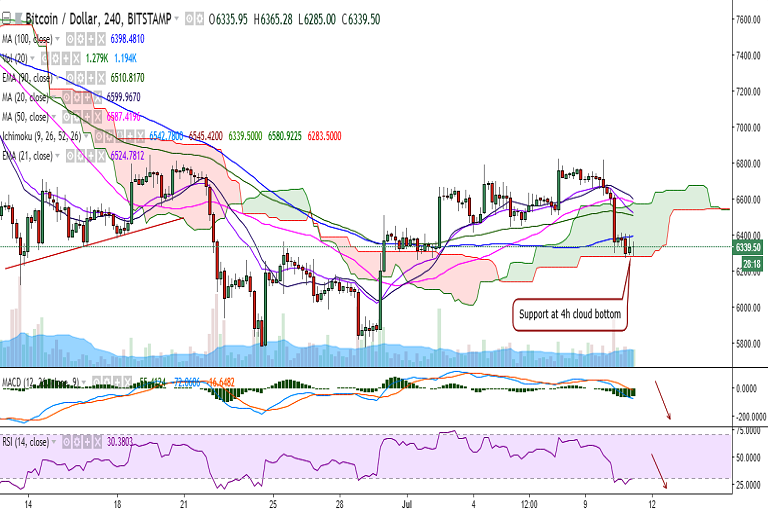
BTC/USD dropped to 6270 levels on Tuesday and closed below 20-DMA at 6299 levels. It is currently trading at 6315 levels at the time of writing (Bitstamp).
On the upside, immediate resistance is seen at 6360 levels and a consistent break above would see it testing 6423 (3h 200-SMA)/6500. Further strength would target 6588 (1h 200-SMA)/ 6759 (23.6% retracement of 9948.98 and 5774.72)
On the downside, the pair has found support near 6283 (4h cloud bottom) and any violation would target 6120 (June 13 low)/5965 (1w 90-EMA). Further weakness would drag it to 5780 (June 24 low).
Momentum studies: Technical indicators suggest bearish bias for the pair on the daily and hourly charts. The price action is also well below major moving averages. The pair has found support near 4h cloud bottom and a break below is likely to see it testing 6000 levels.
Recommendation: Good to go short on decisive break below 4h cloud bottom. SL: 6600. TP: 6120/6000.

- News

- Economy

- Central Banks
- Investing
- Research
- Roundups
- Digital Currency
- Insights
- Technical Analysis
- Technology
- Business
- Law
- Health
- Nature
- Fintech
- Science
- Topic
- Opinions
- ©Econometrics LLC . All Rights Reserved.
FxWirePro: BTC/USD finds support at 4h Cloud bottom, break below likely to test 6000
Wednesday, July 11, 2018 7:37 AM UTC
Editor's Picks


- Market Data
Most Popular


