


 FxWirePro- Major Crypto levels and bias summary
  FxWirePro- Major Crypto levels and bias summary
  Ethereum Retreats in Bitcoin’s Shadow: ETH/USD Tests Critical Support at USD 2,075


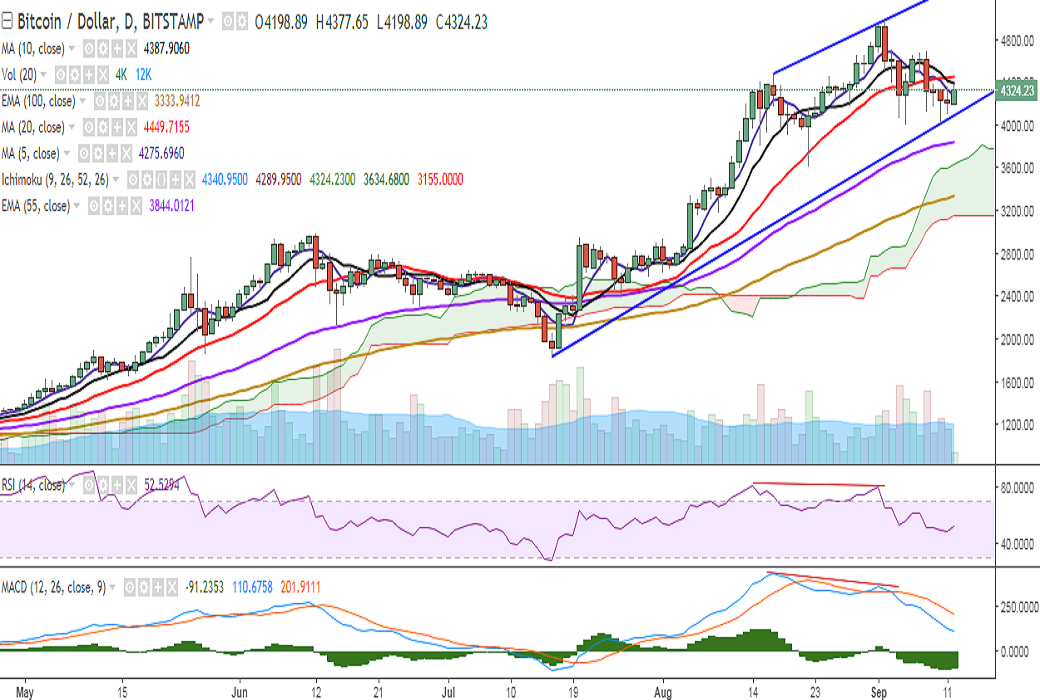
BTC/USD traded in the green on Tuesday and hit 4377 levels so far in the day. It is currently trading at 4300 levels at the time of writing (Bitstamp).
Ichimoku analysis of daily chart:
Tenkan Sen: 4340.95
Kijun Sen: 4289.95
On the upside, the pair faces resistance at 4386 (10-DMA) and a break above would see it testing 4449 (20-DMA)/4480 (August 17 high). Further strength would target 4609 (61.8% retracement of 4979.90 and 4010)/4679 (September 08 high)/4700/4772.
On the downside, support is seen at 4217 (1h 50-SMA) and a break below would see it testing 4127 (61.8% retracement of 3600 and 4979.90)/4090 (trend line joining 1830 and 4010). Further weakness would drag it to 4010 (September 10 low)/ 3895 (78.6% retracement of 3600 and 4979.90)/3840 (50-DMA).
Momentum studies: On the daily chart, RSI is at 52, while MACD line is below the signal line and stochs are biased lower. Also, bearish MACD and RSI divergence could be seen on the daily chart.
On the 1-hour chart, the pair faces strong resistance at 200-SMA and a doji formation could be seen. Also, on the weekly chart, the price action is moving away from upper Bollinger, suggesting scope for further downside.
Watch out for a break below the trend line support.
FxWirePro launches Absolute Return Managed Program. For more details, visit http://www.fxwirepro.com/invest

- News

- Economy

- Central Banks
- Investing
- Research
- Roundups
- Digital Currency
- Insights
- Technical Analysis
- Technology
- Business
- Law
- Health
- Nature
- Fintech
- Science
- Topic
- Opinions
- ©Econometrics LLC . All Rights Reserved.
FxWirePro: BTC/USD faces strong resistance at 20-DMA, good to go short on break below trend line support
Tuesday, September 12, 2017 9:56 AM UTC
Editor's Picks


- Market Data
Most Popular


