


 FxWirePro- Major Crypto levels and bias summary
  NZDJPY Bulls Hold the Line: 92.60 Support Fuels Dip-Buy Setup to 95
  EUR/JPY Poised to Slide — Sell Rallies into 185.30 with Eye on 183"
  GBPJPY Stuck in Tight Range – Neutral Bias Persists Despite Bullish EMAs
  FxWirePro- Major Pair levels and bias summary
  FxWirePro: USD/CAD runs out of steam but maintains bullish outlook
  FxWirePro: USD/CNY edges lower , bearish outlook persists
  FxWirePro: EUR/AUD edges higher but outlook still bearish
  PY Bulls Hold the Line: 92.60 Support Fuels Dip-Buy Setup to 95


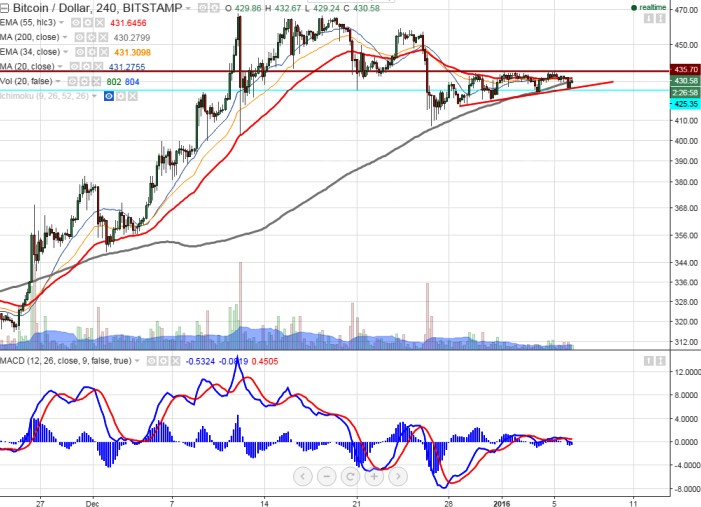
- Chart Pattern Formed- Ascending Triangle Pattern
- BTC/USD declined till $426 yesterday and recovered from that level. It is currently trading around $430.74
hort term trend is still bullish as long as support $400 holds. - The pair's minor resistance is around $436 and any break above will take the pair to next level till $480/$502 is possible. Overall trend reversal can be seen only below $400.
- On the lower side below $400 will drag the pair to next level $380/$ trend reversal only below $348.
It is good to buy at dips around $420 with SL around $400 for the TP of $465/$480


