


 EURGBP Bears Break Trendline: Sell Rallies at 0.8578 as Support Breach Eyes 0.8450 Slide
  FxWirePro: USD/ZAR gains some ground, but downtrend remains
  FxWirePro: AUD/USD eases as investors await U.S. employment figures
  FxWirePro- Major Pair levels and bias summary
  FxWirePro- Woodies pivot (Major)
  FxWirePro- Major Crypto levels and bias summary
  FxWirePro- Major Crypto levels and bias summary
  FxWirePro: GBP/USD eases as dollar firms ahead of U.S. June non-farm payrolls report
  Bitcoin Bulls Hold Key EMAs Above $64,000—Is a Rally Toward $70,000 Next?
  DAX & CAC40 Score Perfect 100: Extremely Bullish With Major Levels to Watch as FTSE100 Hits 80


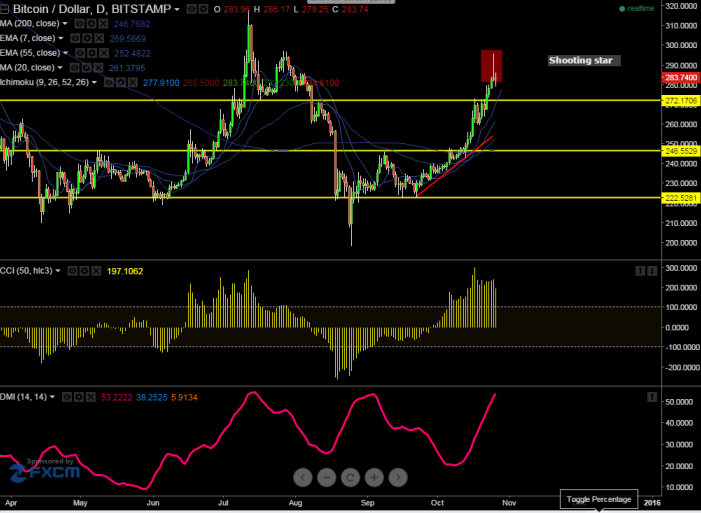
BTC/USD has made a high of $296 and started to decline from that level. Short term trend is bearish as long as resistance $300 holds.
- The pair's minor support is around $277 and any break below will drag the pair further down till $269/$258.
- On the higher side any break above $300 will take the pair till $310/$317.
Indicator (Daily chart)
CCI (50) -Buy
Ichimoku- Buy
We prefer to sell on rallies around $290-92 with SL at $300 for the TP of $277/$268.







