


 Ethereum Steady Above USD 2,000: ETH Tracks Bitcoin’s Lead as Bulls Eye a USD 2,770 Breakout
  Ethereum Trails Bitcoin’s Retreat: Key Support Levels in Focus
  Ethereum Retreats in Bitcoin’s Shadow: ETH/USD Tests Critical Support at USD 2,075
  BTCUSD Coils in Tight Range: Will Geopolitical Stability Trigger a Breakout Toward $80,000?
  FxWirePro- Major Crypto levels and bias summary
  Bitcoin Retreats as Geopolitical Tensions Flare: BTC/USD Dips Following Iran’s Rejection of Ceasefire
  FxWirePro- Major Crypto levels and bias summary


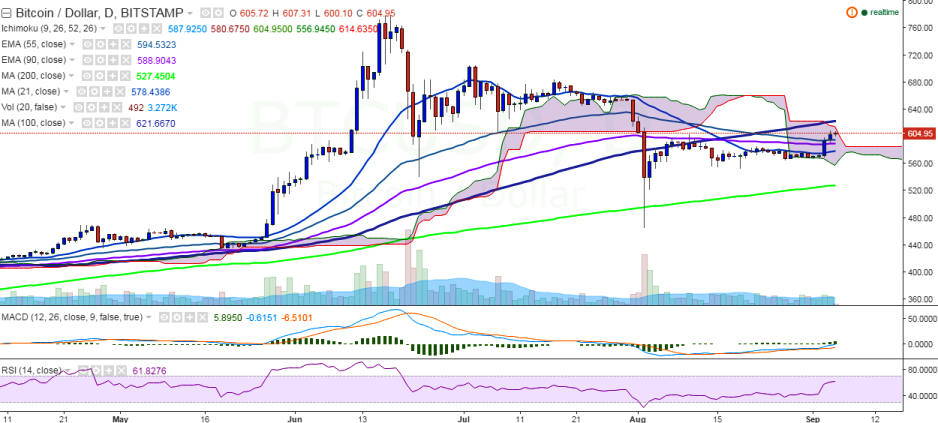
The past weekend was quite eventful for bitcoin as BTC/USD has finally broken above 600 levels, after trading flat for past several days.
The pair is currently trading at 604 levels at the time of writing (Bitstamp).
Long-term trend: Bullish
Short-term trend: Bullish
Ichimoku analysis of daily chart:
Tenkan Sen: 586.93
Kijun Sen: 580.67
Trend reversal: 588.54 (90 EMA)
On the upside, major resistance is seen at 620.81 (100-day MA) and a break above would target 653.69 (78.6% retracement of 704.99 and 465.28)/ 705 (July 3 high).
On the downside, support is seen at 588.54 (90 EMA) and any weakness below this level would drag the pair to 550/ 526.53 (200-day MA).

- News

- Economy

- Central Banks
- Investing
- Research
- Roundups
- Digital Currency
- Insights
- Technical Analysis
- Technology
- Business
- Law
- Health
- Nature
- Fintech
- Science
- Topic
- Opinions
- ©Econometrics LLC . All Rights Reserved.
FxWirePro: BTC/USD breaks above 600, good to buy on dips
Monday, September 5, 2016 6:57 AM UTC
Editor's Picks


- Market Data
Most Popular


