


 FxWirePro- Major Crypto levels and bias summary
  BTC Flat at $89,300 Despite $1.02B ETF Exodus — Buy the Dip Toward $107K?
  Nasdaq Proposes Fast-Track Rule to Accelerate Index Inclusion for Major New Listings
  JPMorgan Lifts Gold Price Forecast to $6,300 by End-2026 on Strong Central Bank and Investor Demand


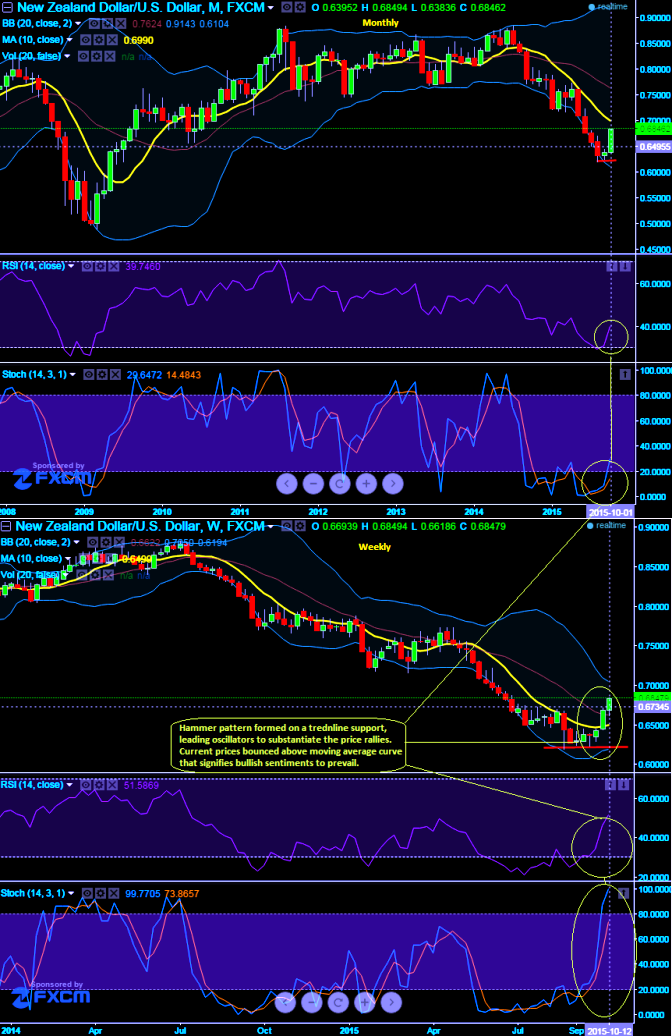
Even though the leading indicators on weekly and monthly charts suggest prevailing price recoveries to sustain further and may even show further strength in near future. Kiwi dollar after continues losing streak that has begun from mid April, it is now making an attempt of recovery a bit as both RSI and stochastic oscillators signaling buying sentiments even though it reached in overbought zones.
RSI on weekly is beautifully converging to the price bounces right from below 30 levels that indicates healthy bull run.
While %K crossover of slow stochastic curve below 20 levels which is oversold territory also suggest buying pressure are strengthened. The current prices on weekly charts bounced above moving average curve that signals the current bull rallies to prevail.
To substantiate this bullish view we also spotted out a hammer pattern on the bottom (at 0.6375 levels) which could be deemed as bullish reversal in medium run. Hammer at the bottom suggest bears have lost interest and bulls have aggressively snatched the price gains, as result long lower shadow is formed from the lows of the week.
We think the only major negative backdrop for kiwi dollar is that Chinese slowdown that may certainly impact adversely on NZD in long term future though short term gains are on the cards.
You can observe on the monthly charts also for the historical evidence as to how the pair has behaved as and when RSI and stochastic curves have simultaneously reached oversold zone. The pair currently held strong supports at 0.6450 levels from one and half months. Hence, it is advisable to buy at every decline for a target of 0.7019 levels.

- News

- Economy

- Central Banks
- Investing
- Research
- Roundups
- Digital Currency
- Insights
- Technical Analysis
- Technology
- Business
- Law
- Health
- Nature
- Fintech
- Science
- Topic
- Opinions
- ©Econometrics LLC . All Rights Reserved.
FxWirePro: Active bulls NZD/USD to extend gains, hammer at bottom signals more potential on upside
Thursday, October 15, 2015 8:52 AM UTC
Editor's Picks


- Market Data
Most Popular


