


AUD/USD chart - Trading View
- AUD/USD slipped below 100-DMA support ans is trading at 0.7127 at 0350 GMT.
- Prospects of China cutting down on its monetary policy measures weighing on the antipodeans.
- Focus shall be on Wednesday's CPI data for further impetus. Poor data could strengthen RBA's rate cut call for May, weighing on the Aussie.
- Analysts at Australia and New Zealand Banking Group (ANZ) expect Australian headline and core CPIs to arrive softer in the first quarter.
- Friday’s gross domestic product (GDP) figures from the US will also be watched to ascertain near-term trade direction.
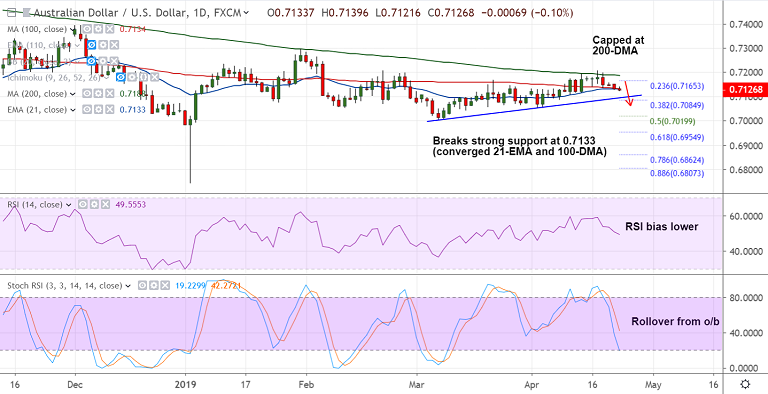
- Technical indicators support downside in the pair. RSI and Stochs are sharply lower.
- Price action has broken strong support at 0.7133 (converged 21-EMA and 100-DMA). Eyes 50-DMA at 0.7112 ahead of 0.7095 (trendline support).
- Retrace and close above 0.7133 could see minor upside. Bearish invalidation only above 200-DMA.
Support levels - 0.7112 (50-DMA), 0.7095 (trendline), 0.7052 (Apr 2 low)
Resistance levels - 0.7133 (converged 21-EMA and 100-DMA), 0.7165 (23.6% Fib), 0.7188 (200-DMA)
Recommendation: Stay short on upticks, SL: 0.7165, TP 0.71/ 0.7085/ 0.7055
For details on FxWirePro's Currency Strength Index, visit http://www.fxwirepro.com/currencyindex.


