


AUD/USD chart on Trading View used for analysis
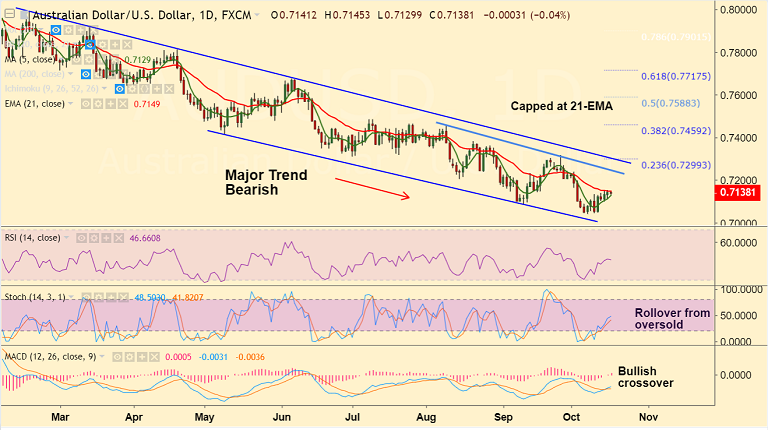
- AUD/USD trades rangebound below 21-EMA at 0.7149, we see further upside only on break above.
- Major trend remains bearish, but technical incicators are turning slightly bullish on the daily charts.
- RSI and Stochs on daily charts are biased higher and MACD is showing a bullish crossover on signal line.
- Upside is currently being capped at 21-EMA, break above targets 55-EMA at 0.7228.
- On the flip side, 5-DMA is immediate support at 0.7128, break below will see resumption of weakness.
- Markets remain cautious heading into the key FOMC September meeting minutes release and Thursday´s Aussie jobs data.
Support levels - 0.7128 (5-DMA), 0.7085 (Sept 11 low), 0.7040 (Oct 8 low)
Resistance levels - 0.7149 (21-EMA), 0.72, 0.7225 (55-EMA)
For details on FxWirePro's Currency Strength Index, visit http://www.fxwirepro.com/currencyindex.


