


AUD/USD chart - Trading View
AUD/USD was trading 0.55% higher on the day at 0.7086 at around 07:00 GMT.
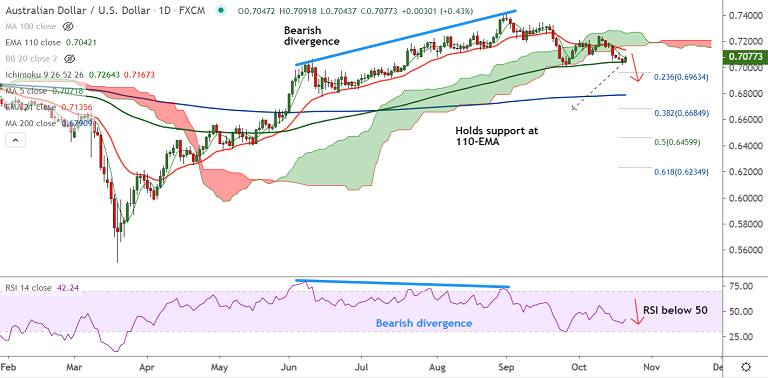
The pair has halted downside after 4 consecutive days of weakness as price action has found strong support at 110-EMA.
Near-term bias for the pair remains bearish as evidenced by the GMMA indicator. Break below 110-EMA will see downside resumption.
Momentum studies are bearish, RSI is below 50. A bearish divergence on the daily charts adds to the downside bias.
The Reserve Bank of Australia (RBA) is widely expected to further cut the cash rate to 0.1% at its Nov.3 meeting and expand its bond-buying programme to include long-dated debt.
Dovish RBA is likely to keep pressure on the Aussie. On the data front Australian retail sales fell again in September.
Data released earlier today showed Australian retail sales fell 1.5% m/m in September, following a 4% decline in August.
Break below 110-EMA will see dip till 23.6% Fib. Further weakness will see test of 200-DMA at 0.6790.


