


AUD/USD chart - Trading View
AUD/USD has erased early gains and has slipped lower from session highs at 0.7368 and was trading 0.14% lower at 0.7339 at around 05:30 GMT.
Resumption of US-China talks after multiple months of silence favor market sentiment and commodity prices.
Additionally, news of potential deal with Iran to solve "the most urgent issue" boosts sentiment.
Technical Analysis:
GMMA Indicator
- Bearish on daily and weekly charts
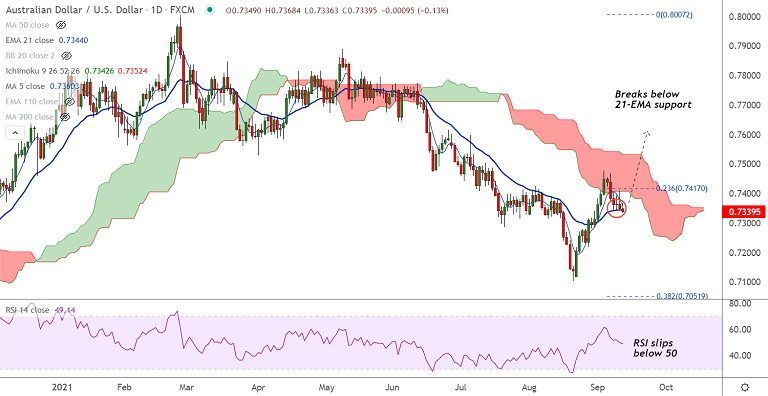
Ichimoku Analysis
- Recovery attempts were capped at daily cloud which is stiff resistance
- Price action is within the weekly cloud
Oscillators
- RSI is biased lower and has slipped below 50 mark, Stochs are biased lower
- Oscillators show bearish bias
Bollinger Bands
- Bollinger bands are widespread, showing high volatility
Summary: AUD/USD price action had been capped between major moving averages - 21 and 55 EMAs from the past few sessions. Break below 21-EMA has reinforced downside bias in the pair.
Next major support lies at 20-DMA at 0.7305. Bearish invalidation only above daily cloud.


