


AUD/USD chart - Trading View
Spot 07:05 GMT: 0.7441
Session's High/ Low: 0.7446/ 0.7421
Previous Week's High/ Low: 0.7555/ 0.7461
Previous Session's High/ Low: 0.7532/ 0.7420
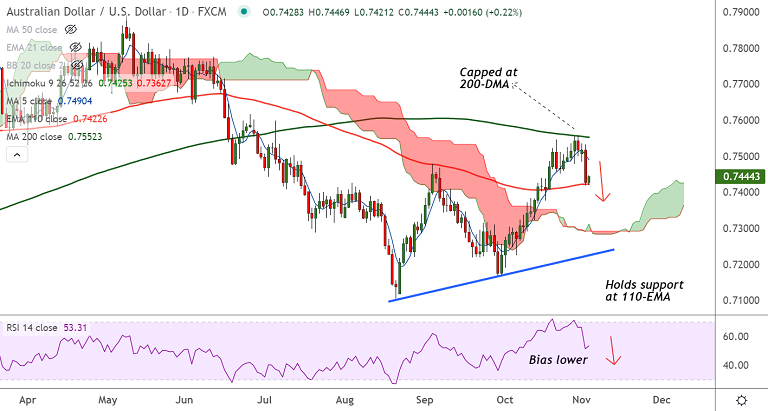
Technical Analysis:
- Upside was rejected at 200-DMA, price action is holding support at 110-EMA
- GMMA indicator shows near term moving averages have turned bearish
- 5-DMA has turned and MACD confirms bearish crossover on signal line
- Stochs show bearish rollover from overbought levels, RSI is biased lower
Fundamental Overview:
The Reserve Bank of Australia (RBA) abandoned its short-term yield target and dropped its expectation of holding rates at record lows until 2024.
The Aussie depressed further because the bank also pushed back on aggressive pricing for 2022 hikes.
Major Support Levels:
S1: 0.7422 (110-EMA)
S2: 0.7393 (55-EMA)
Major Resistance Levels:
R1: 0.7490 (5-DMA)
R2: 0.7552 (200-DMA)
Summary: AUD/USD pivotal at 110-EMA support. Technical bias is tilted bearish. Break below 110-EMA will see weakness. Dip till 0.7393 likely.


