


AUD/USD chart - Trading View
Technical Analysis: Bias Neutral
GMMA Indicator
- Major trend is bullish, minor trend is neutral on the daily charts
- On the weekly charts, minor trend is bullish, while major trend is turning bullish
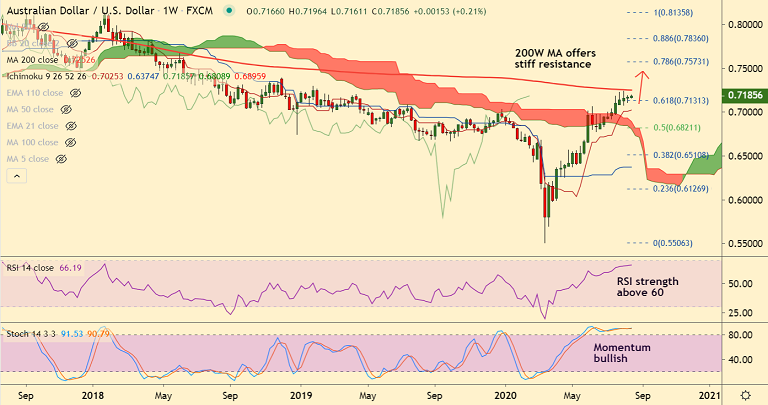
Ichimoku Analysis
- Price action is above cloud on the daily and weekly charts
- Chikou span is biased higher, supporting upside
Oscillators
- Stochs and RSI are biased higher and RSI is above 50 mark
- A bearish divergence on Stochs and RSI on the daily charts raises scope for weakness
Bollinger Bands
- Bollinger bands are shrinking and volatility is low
- Price action pivotal at 21-EMA support
Major Support Levels: 0.7128 (21-EMA), 0.7082 (Kijun Sen), 0.7017 (50-DMA)
Major Resistance Levels: 0.7252 (200W MA), 0.0.7393 (Dec 2018 high), 0.7573 (78.6% Fib)
Summary: The pair trades with a bullish momentum. 200W MA is major resistance at 0.7252. Decisive break above required for upside continuation.


