


AUD/USD chart - Trading View
- AUD/USD rangebound in the Asian session. Aussie muted amid risk aversion.
- Growing fears of slowdown in the U.S. as indicated by the inversion on the yield curve keep investors away from risk assets.
- The pair has made an intraday high of 0.7082 and a low of 0.7065.
- We have no clear indication of intraday direction from the technical indicators.
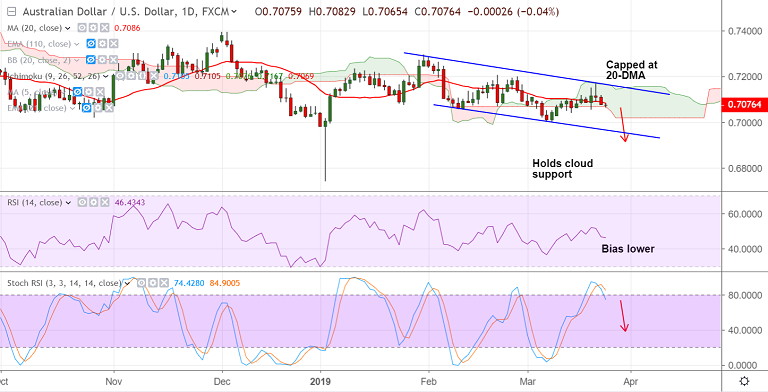
- Major trend is definitely bearish. Price action extends downside in slopping channel.
- Immediate support is seen at daily cloud base at 0.7069. Break below will see further weakness.
- Stochastics RSI indicator is at overbought levels and on verge of rollover. Break below cloud will see downside till channel base.
- Break above 20-DMA at 0.7086 finds next major resistance at 0.7165 (converged cloud and channel top).
Support levels - 0.7067 (cloud base), 0.7003 (Mar 8 low), 0.6965 (channel base)
Resistance levels - 0.7086 (20-DMA), 0.7126 (50-DMA), 0.7159 (100-DMA)
For details on FxWirePro's Currency Strength Index, visit http://www.fxwirepro.com/currencyindex.


