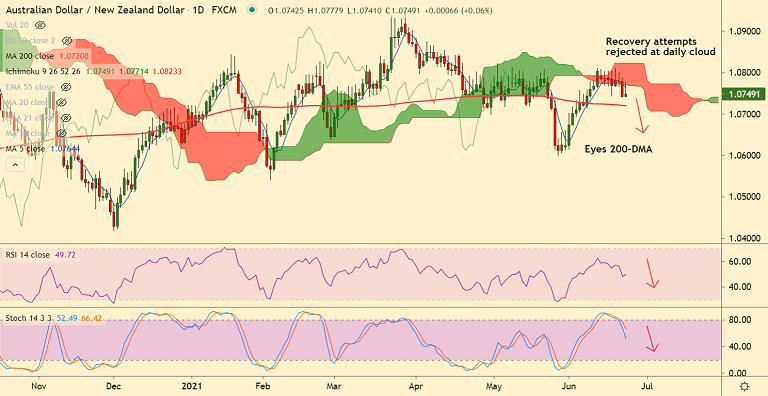
AUD/NZD chart - Trading View
Technical Bias: Bearish
- AUD/NZD was trading 0.08% higher on the day at 1.0750 at around 11:30 GMT
- Recovery attempts were capped at daily cloud, upside lacks traction
- 5-DMA has turned, price action has slipped below 200H MA
- Stochs confirm a bearish rollover from overbought levels, RSI is below 50
- Volatility is high as evidenced by wide Bollinger bands
Support levels - 1.0732 (20-DMA), 1.0720 (200-DMA), 1.0682 (50% Fib)
Resistance levels - 1.0764 (5-DMA), 1.08, 1.0823 (Cloud top)
Summary: AUD/NZD recovery attempts capped at daily cloud. The pair is currently on track to test of 200-DMA at 1.0720. Breach below 200-DMA will open further downside.


Pound Strike Forces EURGBP Retreat – Next Stop 0.8660?
FxWirePro: USD/ZAR extends losses ,eyes 16.400 level
0.7870 Break Looms – Next Stop 0.7800 for USDCHF?
FxWirePro- Major Pair levels and bias summary
FxWirePro: NZD/USD maintains bullish bias with focus on 0.5900
FxWirePro: USD/JPY extends fall as yen rises on intervention fears
FxWirePro: GBP/AUD loses momentum but bullish setup remains
FxWirePro: USD/CNY downside pressure builds, key support level In focus
FxWirePro- Woodies Pivot(Major)
EUR/JPY Surges on Yen Weakness: Bullish Momentum Eyes 186-187 Targets
FxWirePro: EUR/NZD runs out of steam but maintains bullish outlook
FxWirePro- Woodies Pivot(Major)
FxWirePro- Major Crypto levels and bias summary
FxWirePro-Major European Indices
AUDJPY: Buy-the-Dip Strategy Intact Above 103.80 Despite Profit-Taking Pullback
NZDJPY: Bearish Signals Sell-on-Rally Opportunity Below 92 


